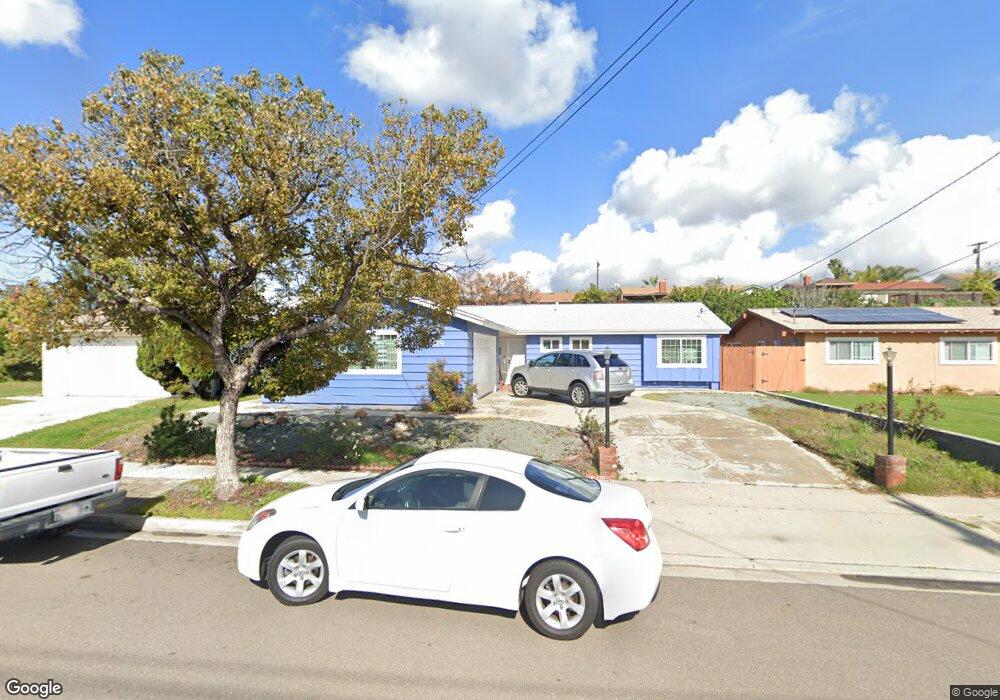
319 E Moss St Chula Vista, CA 91911
Castle Park NeighborhoodEstimated Value: $830,270 - $924,000
3
Beds
2
Baths
1,867
Sq Ft
$471/Sq Ft
Est. Value
About This Home
This home is located at 319 E Moss St, Chula Vista, CA 91911 and is currently estimated at $879,318, approximately $470 per square foot. 319 E Moss St is a home located in San Diego County with nearby schools including Karl H Kellogg Elementary School, Hilltop Middle School, and Hilltop Senior High School.
Ownership History
Date
Name
Owned For
Owner Type
Purchase Details
Closed on
Mar 26, 2009
Sold by
Pope Donald L and Pope Susan L
Bought by
Pope Donald L and Pope Susan L
Current Estimated Value
Purchase Details
Closed on
Sep 6, 2002
Sold by
Pope Donald L and Pope Susan L
Bought by
Pope Donald L and Pope Susan L
Home Financials for this Owner
Home Financials are based on the most recent Mortgage that was taken out on this home.
Original Mortgage
$12,500
Interest Rate
6.37%
Mortgage Type
Credit Line Revolving
Purchase Details
Closed on
Nov 23, 1998
Sold by
Pope Donald L and Pope Susan L
Bought by
Pope Donald L and Pope Susan L L
Home Financials for this Owner
Home Financials are based on the most recent Mortgage that was taken out on this home.
Original Mortgage
$13,000
Interest Rate
6.69%
Create a Home Valuation Report for This Property
The Home Valuation Report is an in-depth analysis detailing your home's value as well as a comparison with similar homes in the area
Home Values in the Area
Average Home Value in this Area
Purchase History
| Date | Buyer | Sale Price | Title Company |
|---|---|---|---|
| Pope Donald L | -- | None Available | |
| Pope Donald L | -- | First American Title Co | |
| Pope Donald L | -- | First American Title | |
| Pope Donald L | -- | First American Title |
Source: Public Records
Mortgage History
| Date | Status | Borrower | Loan Amount |
|---|---|---|---|
| Closed | Pope Donald L | $12,500 | |
| Closed | Pope Donald L | $13,000 |
Source: Public Records
Tax History
| Year | Tax Paid | Tax Assessment Tax Assessment Total Assessment is a certain percentage of the fair market value that is determined by local assessors to be the total taxable value of land and additions on the property. | Land | Improvement |
|---|---|---|---|---|
| 2025 | $1,463 | $131,806 | $20,064 | $111,742 |
| 2024 | $1,463 | $129,222 | $19,671 | $109,551 |
| 2023 | $1,441 | $126,689 | $19,286 | $107,403 |
| 2022 | $1,398 | $124,206 | $18,908 | $105,298 |
| 2021 | $1,365 | $121,772 | $18,538 | $103,234 |
| 2020 | $1,332 | $120,524 | $18,348 | $102,176 |
| 2019 | $1,296 | $118,162 | $17,989 | $100,173 |
| 2018 | $1,275 | $115,846 | $17,637 | $98,209 |
| 2017 | $10 | $113,576 | $17,292 | $96,284 |
| 2016 | $1,215 | $111,350 | $16,953 | $94,397 |
| 2015 | $1,197 | $109,679 | $16,699 | $92,980 |
| 2014 | $1,177 | $107,531 | $16,372 | $91,159 |
Source: Public Records
Map
Nearby Homes
- 953 Maria Way
- 939 Nolan Way
- 902 Monterey Ct
- 445 Montcalm St
- 476 Montclair St
- 1221 Melrose Ave
- 927 Agua Tibia Ave
- 1267 Melrose Ave
- 45 El Capitan Dr
- 466 Thrush St
- 202 E J St
- 161 E Palomar St
- 1324 Park Dr
- 1268 Helix Ave
- 655 Robert Ave
- 1008 Calma Dr
- 41 E Palomar St
- 881 1st Ave
- 607 E J St
- 0 Julian Estates Rd Ct Unit NP26049137
Your Personal Tour Guide
Ask me questions while you tour the home.