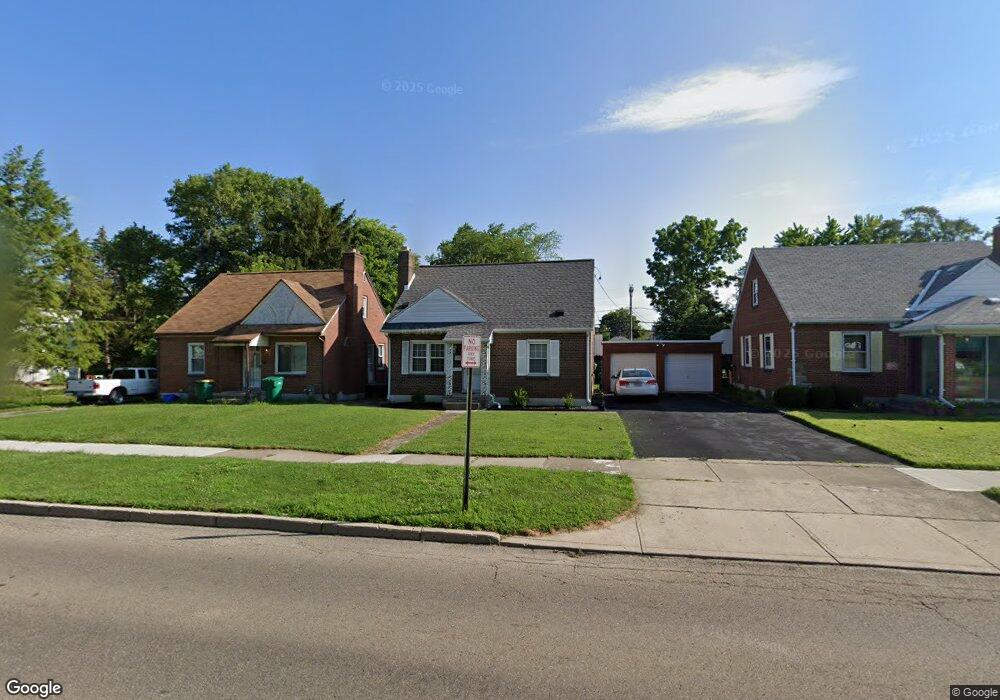
319 E Xenia Dr Fairborn, OH 45324
Estimated Value: $166,000 - $182,000
3
Beds
2
Baths
1,167
Sq Ft
$150/Sq Ft
Est. Value
About This Home
This home is located at 319 E Xenia Dr, Fairborn, OH 45324 and is currently estimated at $175,486, approximately $150 per square foot. 319 E Xenia Dr is a home located in Greene County with nearby schools including Fairborn Primary School, Fairborn Intermediate School, and Fairborn Middle School.
Ownership History
Date
Name
Owned For
Owner Type
Purchase Details
Closed on
Mar 31, 2005
Sold by
Abn Amro Mortgage Group Inc
Bought by
Strader Alan and Strader Laurie
Current Estimated Value
Home Financials for this Owner
Home Financials are based on the most recent Mortgage that was taken out on this home.
Original Mortgage
$66,400
Outstanding Balance
$34,886
Interest Rate
6.06%
Mortgage Type
Fannie Mae Freddie Mac
Estimated Equity
$140,600
Purchase Details
Closed on
Feb 1, 2005
Sold by
Federal Home Loan Mortgage Corporation
Bought by
Abn Amro Mortgage Group Inc
Home Financials for this Owner
Home Financials are based on the most recent Mortgage that was taken out on this home.
Original Mortgage
$66,400
Outstanding Balance
$34,886
Interest Rate
6.06%
Mortgage Type
Fannie Mae Freddie Mac
Estimated Equity
$140,600
Purchase Details
Closed on
Mar 1, 2004
Sold by
Mcdaniel Mark and Mcdaniel Rita
Bought by
Federal Home Loan Mortgage Corporation
Create a Home Valuation Report for This Property
The Home Valuation Report is an in-depth analysis detailing your home's value as well as a comparison with similar homes in the area
Home Values in the Area
Average Home Value in this Area
Purchase History
| Date | Buyer | Sale Price | Title Company |
|---|---|---|---|
| Strader Alan | $83,000 | Resource Title Agency Inc | |
| Abn Amro Mortgage Group Inc | -- | Resource Title Agency Inc | |
| Federal Home Loan Mortgage Corporation | $72,000 | -- |
Source: Public Records
Mortgage History
| Date | Status | Borrower | Loan Amount |
|---|---|---|---|
| Open | Strader Alan | $66,400 |
Source: Public Records
Tax History
| Year | Tax Paid | Tax Assessment Tax Assessment Total Assessment is a certain percentage of the fair market value that is determined by local assessors to be the total taxable value of land and additions on the property. | Land | Improvement |
|---|---|---|---|---|
| 2024 | $2,030 | $43,090 | $10,040 | $33,050 |
| 2023 | $2,015 | $43,090 | $10,040 | $33,050 |
| 2022 | $1,758 | $31,620 | $5,910 | $25,710 |
| 2021 | $1,784 | $31,620 | $5,910 | $25,710 |
| 2020 | $1,793 | $31,620 | $5,910 | $25,710 |
| 2019 | $1,383 | $24,480 | $5,250 | $19,230 |
| 2018 | $1,398 | $24,480 | $5,250 | $19,230 |
| 2017 | $1,407 | $24,480 | $5,250 | $19,230 |
| 2016 | $1,407 | $24,640 | $5,250 | $19,390 |
| 2015 | $1,340 | $24,640 | $5,250 | $19,390 |
| 2014 | $1,295 | $24,640 | $5,250 | $19,390 |
Source: Public Records
Map
Nearby Homes
- 323 Mann Ave
- 340 Holmes Dr
- 112 E Xenia Dr
- 112 Mann Ave
- 211 Holmes Dr
- 313 Archer Dr
- 388-390 Morris Dr Unit 388
- 000 Morris Dr
- 139 Hower Ln
- 303 E Whittier Ave
- 35 S Grand Ave Unit 33
- 437 Kirkwood Dr
- 102 Schneider Dr
- 713-715 Winston Dr
- 108 James Dr
- 711 N Central Ave
- 153 Diana Ln N
- 573 Wildlife Ct
- 315 Greene St
- 226-230 N Broad St