Estimated Value: $849,000 - $1,091,000
4
Beds
2
Baths
1,890
Sq Ft
$494/Sq Ft
Est. Value
About This Home
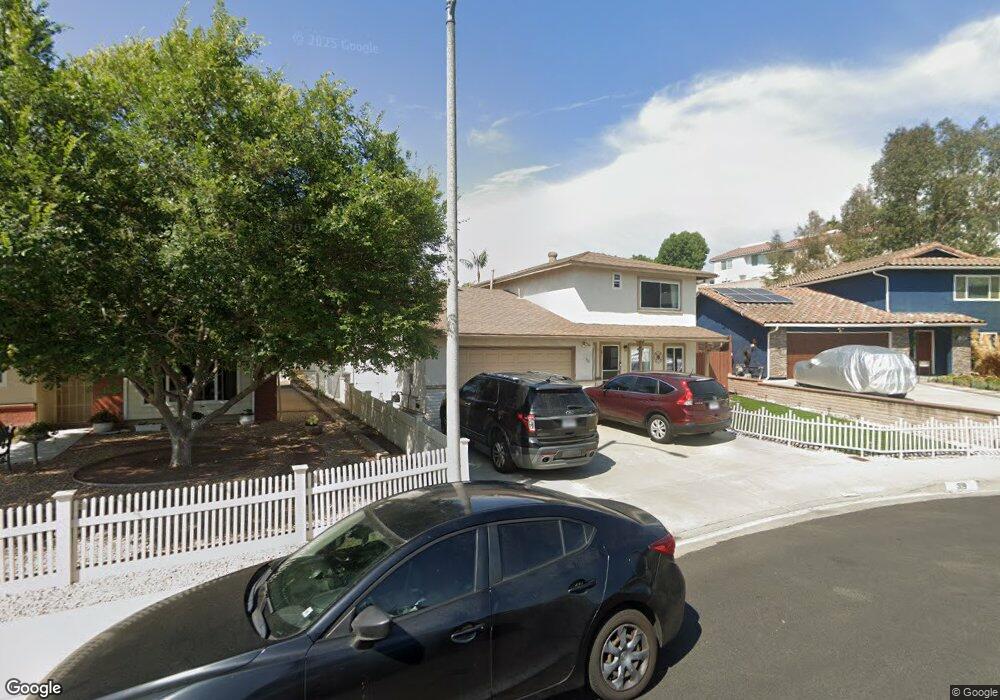
This home is located at 319 Huff St, Vista, CA 92083 and is currently estimated at $933,516, approximately $493 per square foot. 319 Huff St is a home located in San Diego County with nearby schools including Grapevine Elementary School, Madison Middle School, and Rancho Buena Vista High School.
Ownership History
Date
Name
Owned For
Owner Type
Purchase Details
Closed on
Jan 4, 2016
Sold by
Sanchez Richard F and Sanchez Danni S
Bought by
Jimenez Jorge W and Jimenez Elba E
Current Estimated Value
Home Financials for this Owner
Home Financials are based on the most recent Mortgage that was taken out on this home.
Original Mortgage
$360,000
Outstanding Balance
$286,128
Interest Rate
3.94%
Mortgage Type
New Conventional
Estimated Equity
$647,388
Purchase Details
Closed on
Apr 14, 1995
Sold by
Bradford Steven J and Bradford Carol M
Bought by
Sanchez Richard F and Sanchez Danni S
Home Financials for this Owner
Home Financials are based on the most recent Mortgage that was taken out on this home.
Original Mortgage
$143,900
Interest Rate
8.46%
Purchase Details
Closed on
Sep 12, 1994
Sold by
Cox Jerome and Cox Cordelia
Bought by
Beneficial California Inc
Purchase Details
Closed on
Dec 24, 1986
Purchase Details
Closed on
Aug 21, 1985
Purchase Details
Closed on
Mar 1, 1984
Create a Home Valuation Report for This Property
The Home Valuation Report is an in-depth analysis detailing your home's value as well as a comparison with similar homes in the area
Home Values in the Area
Average Home Value in this Area
Purchase History
| Date | Buyer | Sale Price | Title Company |
|---|---|---|---|
| Jimenez Jorge W | $450,000 | Title365 Company | |
| Sanchez Richard F | $151,500 | Fidelity National Title | |
| Beneficial California Inc | -- | Fidelity National Title | |
| -- | $113,500 | -- | |
| -- | $105,100 | -- | |
| -- | $100,000 | -- |
Source: Public Records
Mortgage History
| Date | Status | Borrower | Loan Amount |
|---|---|---|---|
| Open | Jimenez Jorge W | $360,000 | |
| Previous Owner | Sanchez Richard F | $143,900 |
Source: Public Records
Tax History Compared to Growth
Tax History
| Year | Tax Paid | Tax Assessment Tax Assessment Total Assessment is a certain percentage of the fair market value that is determined by local assessors to be the total taxable value of land and additions on the property. | Land | Improvement |
|---|---|---|---|---|
| 2025 | $6,475 | $532,700 | $307,783 | $224,917 |
| 2024 | $6,475 | $522,256 | $301,749 | $220,507 |
| 2023 | $6,337 | $512,017 | $295,833 | $216,184 |
| 2022 | $6,323 | $501,979 | $290,033 | $211,946 |
| 2021 | $6,185 | $492,138 | $284,347 | $207,791 |
| 2020 | $6,152 | $487,093 | $281,432 | $205,661 |
| 2019 | $6,066 | $477,543 | $275,914 | $201,629 |
| 2018 | $5,802 | $468,180 | $270,504 | $197,676 |
| 2017 | $120 | $459,000 | $265,200 | $193,800 |
| 2016 | $2,319 | $214,944 | $86,406 | $128,538 |
| 2015 | $2,960 | $211,717 | $85,109 | $126,608 |
| 2014 | $2,892 | $207,570 | $83,442 | $124,128 |
Source: Public Records
Map
Nearby Homes
- 320 Grapevine Rd Unit 9
- 1636 Jonathon St
- 202 Bay Laurel Ct
- 211 Silver Fir Ct
- 523 Hatherly St
- 2839 Emerald Dr
- 1414 Janis Lynn Ln
- 374 Forest Place
- 4228 Lewis St
- 227 Hill Dr
- 323 Hill Dr
- 233 Hill Dr
- 1713 Cameo Dr
- 4137 Alana Cir
- 4142 Galbar St
- 0 Galaxy Dr
- 000000 College Blvd
- 1532 Olive Ave
- 1937 Sunset Dr
- 1863 Sunset Dr
- 317 Huff St
- 321 Huff St
- 1630 Doris Jean Place
- 1636 Doris Jean Place
- 315 Huff St
- 1622 Doris Jean Place
- 323 Huff St
- 329 Huff St
- 313 Huff St
- 307 Huff St
- 309 Huff St
- 311 Huff St
- 320 Grapevine Rd Unit 6
- 320 Grapevine Rd Unit 3
- 320 Grapevine Rd Unit 11
- 320 Grapevine Rd Unit 1
- 320 Grapevine Rd Unit 108
- 320 Grapevine Rd Unit 15
- 320 Grapevine Rd Unit 114
- 320 Grapevine Rd Unit 13