Estimated Value: $155,000 - $167,964
2
Beds
1
Bath
720
Sq Ft
$223/Sq Ft
Est. Value
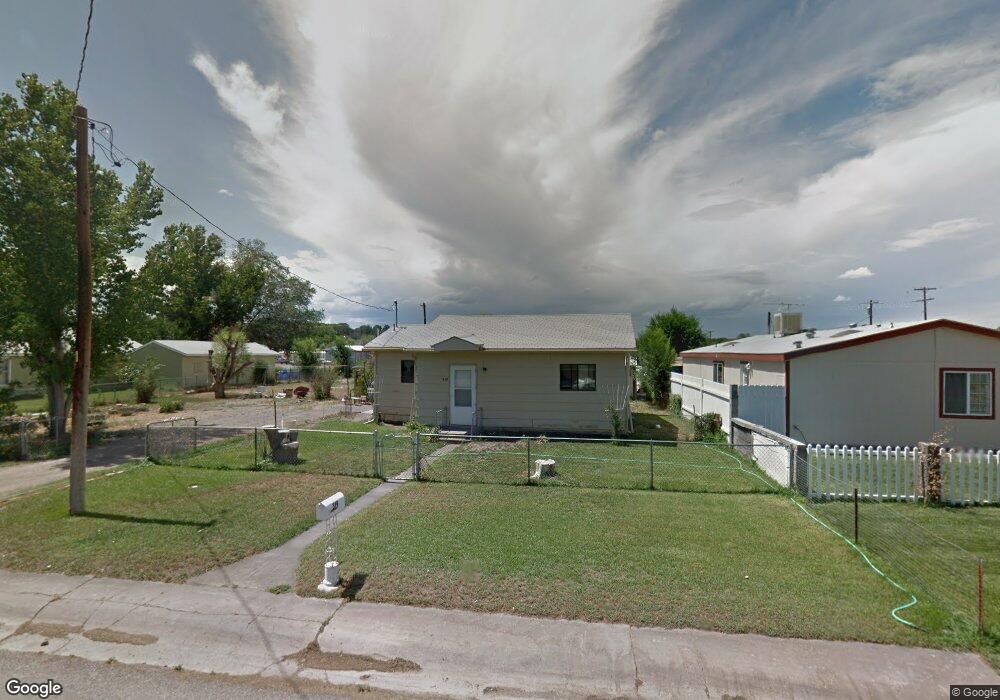
About This Home
This home is located at 319 Kellogg St, Delta, CO 81416 and is currently estimated at $160,741, approximately $223 per square foot. 319 Kellogg St is a home located in Delta County with nearby schools including Garnet Mesa Elementary School, Lincoln Elementary School, and Delta Middle School.
Ownership History
Date
Name
Owned For
Owner Type
Purchase Details
Closed on
Dec 11, 2025
Sold by
Bynum Blake D and Bynum Danielle A
Bought by
Lopez Larry L
Current Estimated Value
Home Financials for this Owner
Home Financials are based on the most recent Mortgage that was taken out on this home.
Original Mortgage
$127,070
Outstanding Balance
$127,070
Interest Rate
6.17%
Mortgage Type
New Conventional
Estimated Equity
$33,671
Purchase Details
Closed on
Dec 7, 2011
Sold by
Flores Susan L
Bought by
Bynum Blake D and Bynum Danielle A
Purchase Details
Closed on
Nov 15, 2011
Sold by
Flores Michael L
Bought by
Flores Susan L
Purchase Details
Closed on
Oct 17, 2011
Sold by
Flores Susan L
Bought by
Flores Michael L
Purchase Details
Closed on
Dec 21, 2009
Sold by
Trujillo Senny
Bought by
Flores Susan L
Purchase Details
Closed on
Nov 18, 2008
Sold by
Manzanares Beatrice
Bought by
Trujillo Seeny and Trujillo Senny
Create a Home Valuation Report for This Property
The Home Valuation Report is an in-depth analysis detailing your home's value as well as a comparison with similar homes in the area
Purchase History
| Date | Buyer | Sale Price | Title Company |
|---|---|---|---|
| Lopez Larry L | $156,000 | Land Title Guarantee | |
| Bynum Blake D | $15,000 | None Available | |
| Flores Susan L | -- | None Available | |
| Flores Michael L | -- | None Available | |
| Flores Susan L | -- | None Available | |
| Trujillo Seeny | -- | None Available |
Source: Public Records
Mortgage History
| Date | Status | Borrower | Loan Amount |
|---|---|---|---|
| Open | Lopez Larry L | $127,070 | |
| Closed | Lopez Larry L | $23,400 |
Source: Public Records
Tax History
| Year | Tax Paid | Tax Assessment Tax Assessment Total Assessment is a certain percentage of the fair market value that is determined by local assessors to be the total taxable value of land and additions on the property. | Land | Improvement |
|---|---|---|---|---|
| 2024 | $199 | $3,004 | $1,128 | $1,876 |
| 2023 | $199 | $3,004 | $1,128 | $1,876 |
| 2022 | $247 | $3,825 | $1,117 | $2,708 |
| 2021 | $249 | $3,935 | $1,149 | $2,786 |
| 2020 | $209 | $3,255 | $1,021 | $2,234 |
| 2019 | $207 | $3,255 | $1,021 | $2,234 |
| 2018 | $211 | $3,200 | $1,440 | $1,760 |
| 2017 | $205 | $3,200 | $1,440 | $1,760 |
| 2016 | $189 | $3,223 | $1,457 | $1,766 |
| 2014 | -- | $3,048 | $1,457 | $1,591 |
Source: Public Records
Map
Nearby Homes
- 337 & 341 Palmer St
- 6154 Graff Rd
- 14885 G Rd
- 295 W 7th St
- 775 Columbia St
- 155 E 7th St
- 308 Grand Ave
- 167 Gunnison River Dr
- 464 & 464 1/2 Grand Ave
- 308 E 4th St
- 309 E 3rd St
- 739 Meeker St
- 314 Howard St
- 965 Palmer St
- TBD 4th St
- 523 Bluff St
- 1025 Palmer St
- 320 Grand Blvd
- 919 Grand Ave
- 676 Highway 50 Unit 44
- 327 Kellogg St
- 311 Kellogg St
- 349 Kellogg St
- 600 & 602 W 3rd St
- 600 & 602 3rd
- 600 & 602 W 3rd St
- 359 Kellogg St
- 336 Kellogg St
- 0 Kellogg St
- 340 Kellogg St
- 259 and 259 1/2 Kellogg St
- 306 Kellogg St
- Lot Kellogg St
- 259 Kellogg St
- 259 1/2 Kellogg St
- 348 Kellogg St
- 356 Kellogg St
- W 4th St
- 360 Kellogg St
- 602 W 4th St
Your Personal Tour Guide
Ask me questions while you tour the home.