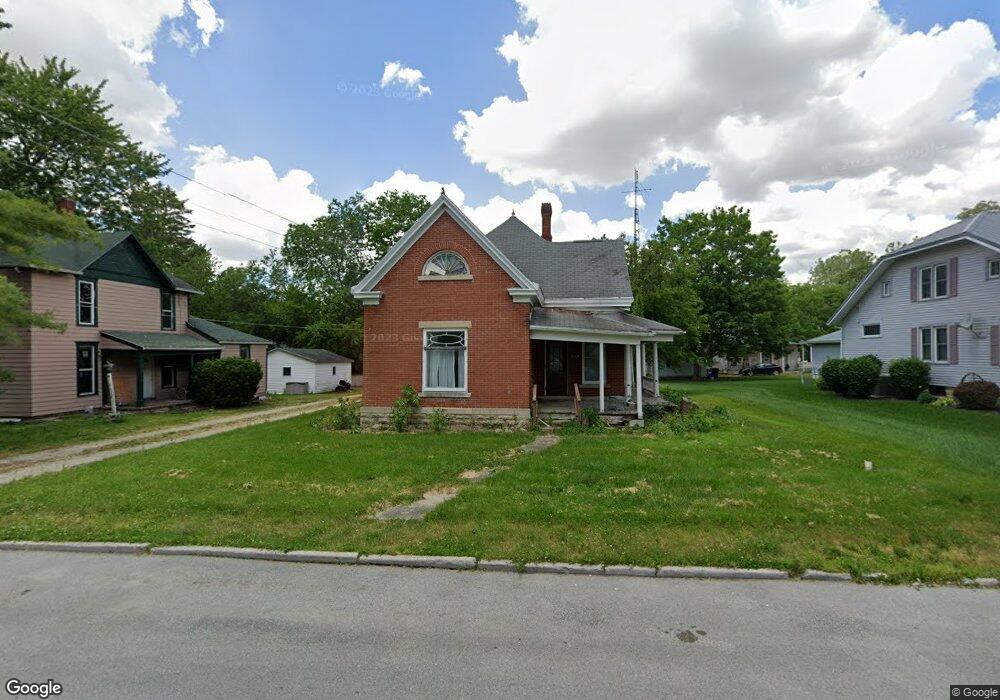
319 N Matilda St Warren, IN 46792
Estimated Value: $119,000 - $156,000
2
Beds
1
Bath
2,697
Sq Ft
$52/Sq Ft
Est. Value
About This Home
This home is located at 319 N Matilda St, Warren, IN 46792 and is currently estimated at $140,235, approximately $51 per square foot. 319 N Matilda St is a home located in Huntington County with nearby schools including Salamonie School and Huntington North High School.
Ownership History
Date
Name
Owned For
Owner Type
Purchase Details
Closed on
Mar 27, 2020
Sold by
Nash Sandra K
Bought by
Lubia John
Current Estimated Value
Purchase Details
Closed on
Sep 11, 2008
Sold by
Sec Of Housing & Urban Deve
Bought by
Lehman Sandra K
Purchase Details
Closed on
Sep 9, 2008
Sold by
Secretary Of Hud
Bought by
Lehman Sandra K
Purchase Details
Closed on
Mar 20, 2008
Sold by
Driscoll Jeffery M and Driscoll Heather C
Bought by
Flagstar Bank Fsb
Purchase Details
Closed on
Mar 14, 2008
Sold by
Flagstar Bank
Bought by
Secretary Of Hud
Create a Home Valuation Report for This Property
The Home Valuation Report is an in-depth analysis detailing your home's value as well as a comparison with similar homes in the area
Home Values in the Area
Average Home Value in this Area
Purchase History
| Date | Buyer | Sale Price | Title Company |
|---|---|---|---|
| Lubia John | -- | None Available | |
| Lehman Sandra K | $24,000 | -- | |
| Lehman Sandra K | -- | None Available | |
| Flagstar Bank Fsb | $62,761 | None Available | |
| Secretary Of Hud | -- | None Available |
Source: Public Records
Tax History Compared to Growth
Tax History
| Year | Tax Paid | Tax Assessment Tax Assessment Total Assessment is a certain percentage of the fair market value that is determined by local assessors to be the total taxable value of land and additions on the property. | Land | Improvement |
|---|---|---|---|---|
| 2024 | $448 | $88,900 | $11,600 | $77,300 |
| 2023 | $1,512 | $75,600 | $11,600 | $64,000 |
| 2022 | $1,378 | $68,900 | $11,600 | $57,300 |
| 2021 | $1,286 | $64,300 | $11,600 | $52,700 |
| 2020 | $1,286 | $64,300 | $11,600 | $52,700 |
| 2019 | $1,120 | $56,000 | $11,600 | $44,400 |
| 2018 | $1,070 | $53,500 | $11,600 | $41,900 |
| 2017 | $1,064 | $53,200 | $11,600 | $41,600 |
| 2016 | $1,054 | $52,700 | $11,600 | $41,100 |
| 2014 | $1,014 | $50,700 | $11,600 | $39,100 |
| 2013 | $1,014 | $49,100 | $11,600 | $37,500 |
Source: Public Records
Map
Nearby Homes