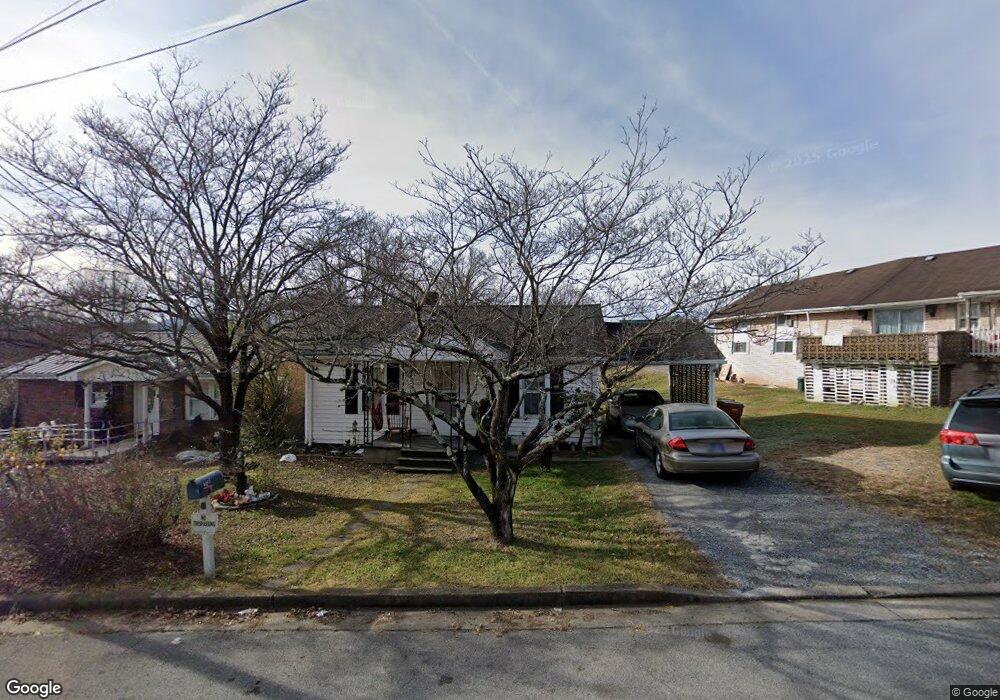
319 Roosevelt St Johnson City, TN 37601
Estimated Value: $93,000 - $131,000
--
Bed
1
Bath
616
Sq Ft
$170/Sq Ft
Est. Value
About This Home
This home is located at 319 Roosevelt St, Johnson City, TN 37601 and is currently estimated at $104,928, approximately $170 per square foot. 319 Roosevelt St is a home located in Washington County with nearby schools including Fairmont Elementary School, Liberty Bell Middle School, and Indian Trail Middle School.
Ownership History
Date
Name
Owned For
Owner Type
Purchase Details
Closed on
Nov 6, 2025
Sold by
Reid Trisha Nevin and Reid Joseph Keefauver
Bought by
Trisha M Reid Trust and Reid
Current Estimated Value
Purchase Details
Closed on
Dec 15, 2021
Sold by
Orville Phillips
Bought by
Reid Joseph K and Reid Trish N
Purchase Details
Closed on
Oct 25, 2021
Sold by
Marion Michael and Marion Sherry
Bought by
Phillips Orville
Purchase Details
Closed on
Jun 25, 2012
Sold by
Fillers Jimmie Dale
Bought by
Marion Michael and Marion Sherry
Home Financials for this Owner
Home Financials are based on the most recent Mortgage that was taken out on this home.
Original Mortgage
$36,500
Interest Rate
3.79%
Mortgage Type
Commercial
Purchase Details
Closed on
Dec 1, 2011
Sold by
Fillers Jim
Bought by
Fillers Evelyn
Purchase Details
Closed on
Sep 5, 2007
Sold by
Fillers Evelyn
Bought by
Fillers Jim
Create a Home Valuation Report for This Property
The Home Valuation Report is an in-depth analysis detailing your home's value as well as a comparison with similar homes in the area
Home Values in the Area
Average Home Value in this Area
Purchase History
| Date | Buyer | Sale Price | Title Company |
|---|---|---|---|
| Trisha M Reid Trust | -- | None Listed On Document | |
| Reid Joseph K | $28,000 | None Listed On Document | |
| Phillips Orville | $28,000 | None Available | |
| Marion Michael | $43,050 | -- | |
| Fillers Evelyn | -- | -- | |
| Fillers Jim | -- | -- |
Source: Public Records
Mortgage History
| Date | Status | Borrower | Loan Amount |
|---|---|---|---|
| Previous Owner | Marion Michael | $36,500 |
Source: Public Records
Tax History Compared to Growth
Tax History
| Year | Tax Paid | Tax Assessment Tax Assessment Total Assessment is a certain percentage of the fair market value that is determined by local assessors to be the total taxable value of land and additions on the property. | Land | Improvement |
|---|---|---|---|---|
| 2024 | $357 | $20,850 | $5,325 | $15,525 |
| 2023 | $245 | $11,375 | $0 | $0 |
| 2022 | $245 | $11,375 | $3,450 | $7,925 |
| 2021 | $441 | $11,375 | $3,450 | $7,925 |
| 2020 | $440 | $11,375 | $3,450 | $7,925 |
| 2019 | $230 | $11,375 | $3,450 | $7,925 |
| 2018 | $412 | $9,650 | $2,500 | $7,150 |
| 2017 | $412 | $9,650 | $2,500 | $7,150 |
| 2016 | $410 | $9,650 | $2,500 | $7,150 |
| 2015 | $372 | $9,650 | $2,500 | $7,150 |
| 2014 | $347 | $9,650 | $2,500 | $7,150 |
Source: Public Records
Map
Nearby Homes
- 2112 E Watauga Ave
- 2107 E Watauga Ave
- 909 Pine Grove Ave
- 2239 E Fairview Ave
- 1808 E Myrtle Ave
- 1213 Glynridge St
- 807 Long St
- 604 Duke St
- 570 Sedgewick Way
- 1701 E Millard St
- 1620 Fairway Dr
- 1700 E Millard St
- 1605 E Myrtle Ave
- 1448 Piedmont St
- 1607 E Millard St
- 1510 E Chilhowie Ave
- 1501 E Fairview Ave
- 1917 Club Dr
- 1411 E Unaka Ave
- 1304 E Chilhowie Ave
- 317 Roosevelt St
- 315 Roosevelt St
- 2112 E Unaka Ave
- 313 Roosevelt St
- 2201 Midway St
- 311 Roosevelt St
- 2108 E Unaka Ave
- 2200 E Unaka Ave
- 2109 E Unaka Ave
- 2205 Midway St
- 2106 E Unaka Ave
- 308 Roosevelt St
- 309 Roosevelt St
- 2207 Midway St
- 2202 E Unaka Ave
- 2104 E Unaka Ave
- 903 Country Club Dr
- 2209 Midway St
- 2204 E Unaka Ave
- 2204 Midway St