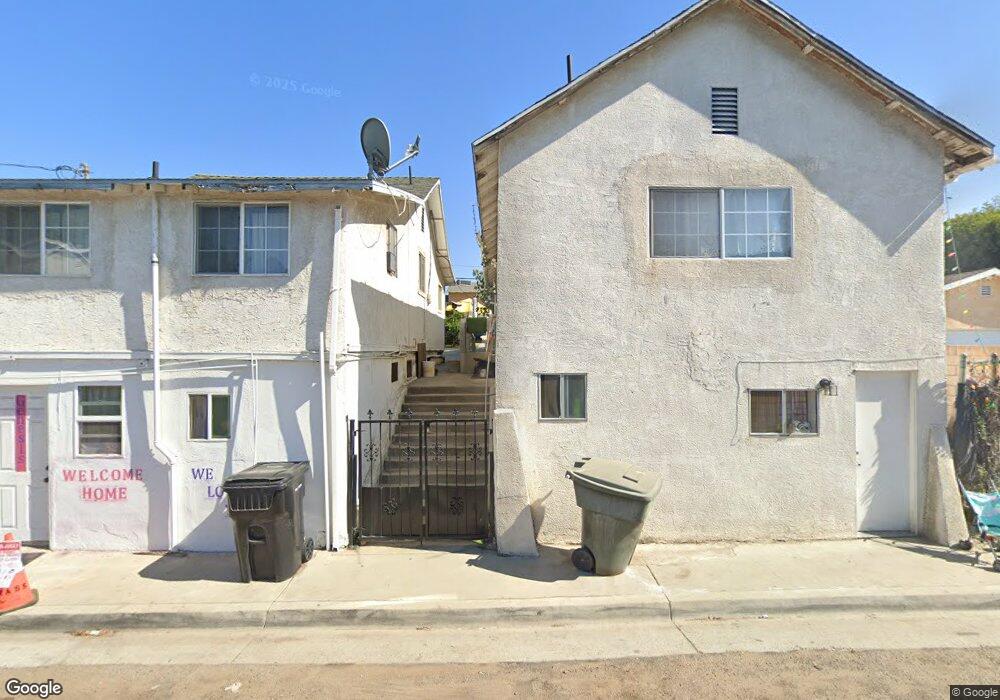
319 S Walnut Ave Placentia, CA 92870
Estimated Value: $570,000 - $710,000
1
Bed
1
Bath
900
Sq Ft
$689/Sq Ft
Est. Value
About This Home
This home is located at 319 S Walnut Ave, Placentia, CA 92870 and is currently estimated at $620,018, approximately $688 per square foot. 319 S Walnut Ave is a home located in Orange County with nearby schools including Morse Avenue Elementary School, Kraemer Middle School, and Valencia High School.
Ownership History
Date
Name
Owned For
Owner Type
Purchase Details
Closed on
Jan 15, 2001
Sold by
Rivera Alfonso U and Quiroz Alfonso
Bought by
Rivera Alfonso U
Current Estimated Value
Purchase Details
Closed on
Nov 9, 2000
Sold by
Rosales Silvia
Bought by
Negrete Santiago
Purchase Details
Closed on
Aug 16, 2000
Sold by
Bautista Julio R
Bought by
Quiroz Alfonso and Rivera Alfonso U
Home Financials for this Owner
Home Financials are based on the most recent Mortgage that was taken out on this home.
Original Mortgage
$236,874
Interest Rate
7.88%
Mortgage Type
FHA
Purchase Details
Closed on
Mar 10, 1997
Sold by
Joe Aguirre Alfred
Bought by
Bautista Julio and Bautista Luis
Home Financials for this Owner
Home Financials are based on the most recent Mortgage that was taken out on this home.
Original Mortgage
$131,050
Interest Rate
7.63%
Mortgage Type
FHA
Create a Home Valuation Report for This Property
The Home Valuation Report is an in-depth analysis detailing your home's value as well as a comparison with similar homes in the area
Home Values in the Area
Average Home Value in this Area
Purchase History
| Date | Buyer | Sale Price | Title Company |
|---|---|---|---|
| Rivera Alfonso U | -- | United Title Company | |
| Negrete Santiago | -- | -- | |
| Quiroz Alfonso | $240,000 | Old Republic Title Company | |
| Bautista Julio | $88,000 | American Title Co |
Source: Public Records
Mortgage History
| Date | Status | Borrower | Loan Amount |
|---|---|---|---|
| Previous Owner | Quiroz Alfonso | $236,874 | |
| Previous Owner | Bautista Julio | $131,050 |
Source: Public Records
Tax History
| Year | Tax Paid | Tax Assessment Tax Assessment Total Assessment is a certain percentage of the fair market value that is determined by local assessors to be the total taxable value of land and additions on the property. | Land | Improvement |
|---|---|---|---|---|
| 2025 | $5,148 | $355,954 | $317,115 | $38,839 |
| 2024 | $5,148 | $348,975 | $310,897 | $38,078 |
| 2023 | $4,993 | $342,133 | $304,801 | $37,332 |
| 2022 | $4,849 | $335,425 | $298,825 | $36,600 |
| 2021 | $4,670 | $328,849 | $292,966 | $35,883 |
| 2020 | $4,682 | $325,478 | $289,962 | $35,516 |
| 2019 | $4,466 | $319,097 | $284,277 | $34,820 |
| 2018 | $4,400 | $312,841 | $278,703 | $34,138 |
| 2017 | $4,319 | $306,707 | $273,238 | $33,469 |
| 2016 | $4,234 | $300,694 | $267,881 | $32,813 |
| 2015 | $4,172 | $296,178 | $263,857 | $32,321 |
| 2014 | $4,065 | $290,377 | $258,689 | $31,688 |
Source: Public Records
Map
Nearby Homes
- 412 W Santa fe Ave
- 315 Baker St
- 201 S Melrose St
- 449 Melody Ln
- 2617 Pearson Ave
- 503 Wilson Cir
- 161 E Orangethorpe Ave Unit 102
- 161 E Orangethorpe Ave Unit 81
- 161 E Orangethorpe Ave Unit 163
- 210 Silverlake Dr
- 2518 Pearson Ave
- 215 Lakepark Dr
- 2500 Santa Ysabel Ave
- 102 Kauai Ln
- 2470 Santa Clara Ave
- 410 N Angelina Dr
- 2428 Santa Clara Ave
- 212 S Kraemer Blvd Unit 2616
- 212 S Kraemer Blvd Unit 908
- 212 S Kraemer Blvd Unit 2208
- 321 S Walnut Ave
- 315 S Walnut Ave
- 311 S Walnut Ave
- 307 S Walnut Ave
- 320 S Walnut Ave
- 312 Santa Barbara St
- 308 Santa Barbara St
- 316 Santa Barbara St
- 304 Santa Barbara St
- 320 Santa Barbara St
- 300 Santa Barbara St
- 334 Baker St
- 324 Santa Barbara St
- 350 W Santa fe Ave
- 332 Baker St
- 323 Baker St
- 328 Santa Barbara St
- 326 Baker St
- 239 S Walnut Ave
- 340 W Santa fe Ave
Your Personal Tour Guide
Ask me questions while you tour the home.