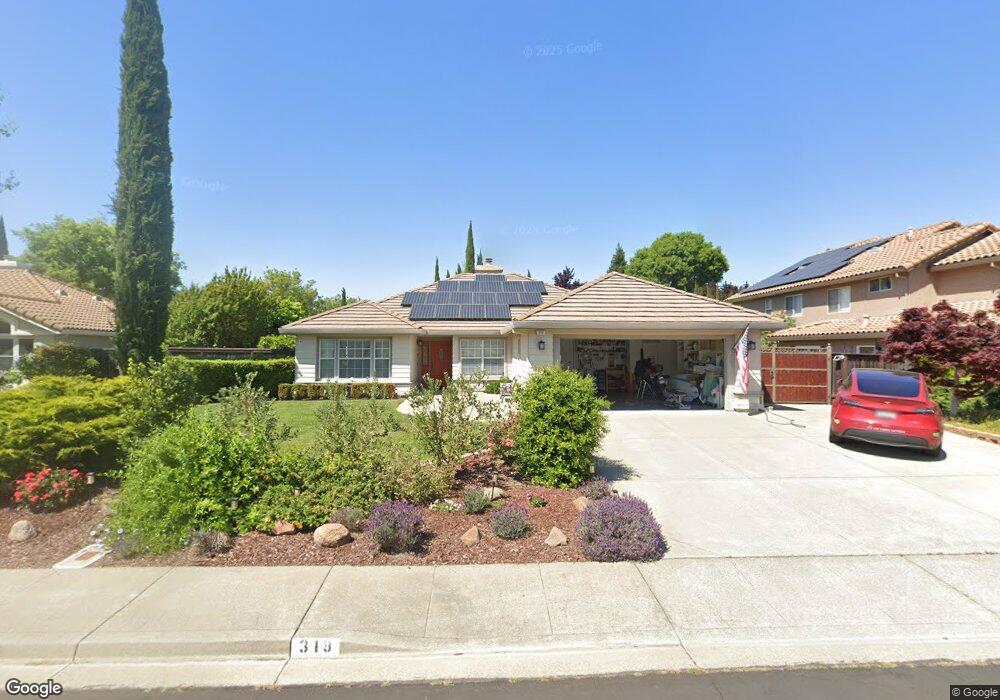
319 Stonecastle Way Vacaville, CA 95687
Estimated Value: $664,759 - $796,000
4
Beds
3
Baths
2,033
Sq Ft
$374/Sq Ft
Est. Value
About This Home
This home is located at 319 Stonecastle Way, Vacaville, CA 95687 and is currently estimated at $759,940, approximately $373 per square foot. 319 Stonecastle Way is a home located in Solano County with nearby schools including Cooper Elementary School, Orchard Elementary School, and Vaca Pena Middle School.
Ownership History
Date
Name
Owned For
Owner Type
Purchase Details
Closed on
Dec 13, 2006
Sold by
Tupy Allen D and Tupy Yurika T
Bought by
Tupy Allen D and Tupy Yurika T
Current Estimated Value
Purchase Details
Closed on
Mar 22, 2001
Sold by
Tupy Allen D and Tupy Yurika T
Bought by
Tupy Allen D and Tupy Yurika T
Home Financials for this Owner
Home Financials are based on the most recent Mortgage that was taken out on this home.
Original Mortgage
$319,000
Outstanding Balance
$115,722
Interest Rate
6.97%
Estimated Equity
$644,218
Purchase Details
Closed on
Oct 16, 2000
Sold by
Paddock Brian J and Paddock G L
Bought by
Babakan Charles W and Babakan Julia M
Purchase Details
Closed on
Dec 7, 1993
Sold by
Paddock Joseph L and Paddock Elaine B
Bought by
Paddock Brian J and Paddock Gretchen L
Home Financials for this Owner
Home Financials are based on the most recent Mortgage that was taken out on this home.
Original Mortgage
$184,000
Interest Rate
7.09%
Create a Home Valuation Report for This Property
The Home Valuation Report is an in-depth analysis detailing your home's value as well as a comparison with similar homes in the area
Home Values in the Area
Average Home Value in this Area
Purchase History
| Date | Buyer | Sale Price | Title Company |
|---|---|---|---|
| Tupy Allen D | -- | None Available | |
| Tupy Allen D | -- | North American Title Co | |
| Tudy Allen D | $319,000 | North American Title Co | |
| Babakan Charles W | $314,000 | North American Title Co | |
| Paddock Brian J | $115,000 | -- |
Source: Public Records
Mortgage History
| Date | Status | Borrower | Loan Amount |
|---|---|---|---|
| Open | Tudy Allen D | $319,000 | |
| Previous Owner | Paddock Brian J | $184,000 |
Source: Public Records
Tax History Compared to Growth
Tax History
| Year | Tax Paid | Tax Assessment Tax Assessment Total Assessment is a certain percentage of the fair market value that is determined by local assessors to be the total taxable value of land and additions on the property. | Land | Improvement |
|---|---|---|---|---|
| 2025 | $3,823 | $480,674 | $97,937 | $382,737 |
| 2024 | $3,823 | $471,250 | $96,017 | $375,233 |
| 2023 | $3,862 | $462,011 | $94,135 | $367,876 |
| 2022 | $3,885 | $452,953 | $92,290 | $360,663 |
| 2021 | $3,861 | $444,073 | $90,481 | $353,592 |
| 2020 | $3,836 | $439,521 | $89,554 | $349,967 |
| 2019 | $5,304 | $430,904 | $87,799 | $343,105 |
| 2018 | $5,193 | $422,456 | $86,078 | $336,378 |
| 2017 | $5,001 | $414,174 | $84,391 | $329,783 |
| 2016 | $4,968 | $406,054 | $82,737 | $323,317 |
| 2015 | $4,898 | $399,956 | $81,495 | $318,461 |
| 2014 | $4,604 | $392,122 | $79,899 | $312,223 |
Source: Public Records
Map
Nearby Homes
- 406 Stonecastle Way
- 1025 Fallen Leaf Place
- 206 Willow Green Way
- 6388 Leisure Town Rd
- 107 Inyo Ct
- 418 Gatehouse Dr
- 442 Yellowstone Dr
- 903 Rio Grande Dr
- 1018 Alouette Place
- 201 Lassen Cir Unit 4
- 101 Mckinley Cir
- 649 Whitney Ct
- 189 Lassen Cir
- 431 Stanford St
- 103 Carlsbad Cir
- 755 Oak Hollow Ave
- 636 Yellowstone Dr
- 642 Yellowstone Dr
- 178 Mckinley Cir
- 206 Colby Dr
- 313 Stonecastle Way
- 325 Stonecastle Way
- 242 Stonegate Dr
- 236 Stonegate Dr
- 307 Stonecastle Way
- 331 Stonecastle Way
- 230 Stonegate Dr
- 324 Stonecastle Way
- 249 Fairgate Dr
- 254 Stonegate Dr
- 330 Stonecastle Way
- 224 Stonegate Dr
- 301 Stonecastle Way
- 337 Stonecastle Way
- 243 Fairgate Dr
- 254 Willow Green Way
- 236 Fairgate Dr
- 218 Stonegate Dr
- 260 Stonegate Dr