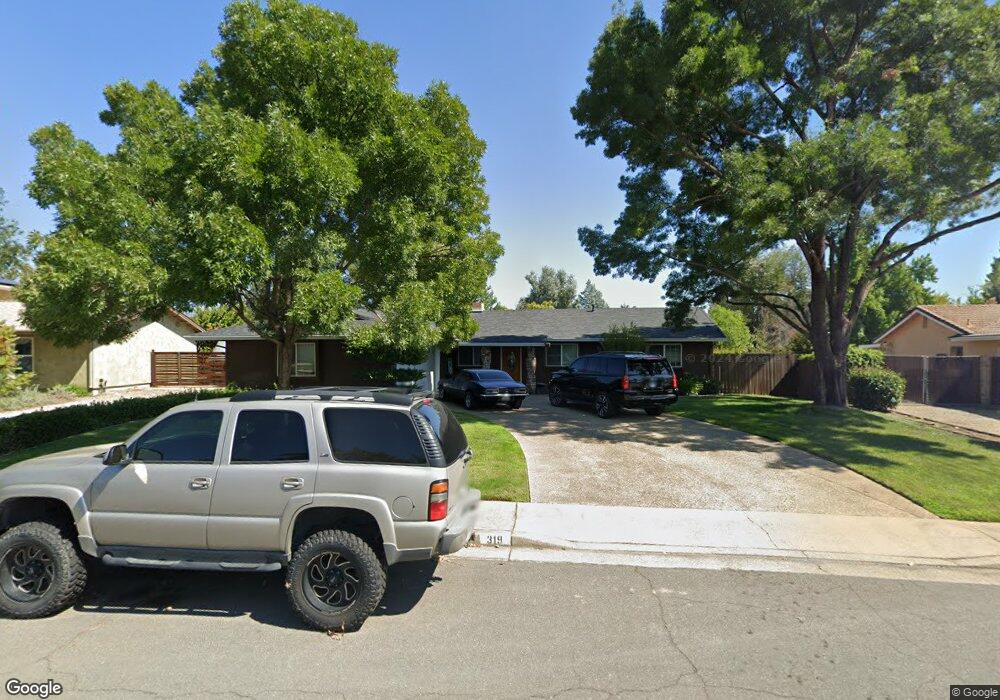
319 Tourmaline Way Redding, CA 96003
Lake Redding NeighborhoodEstimated Value: $394,000 - $425,000
3
Beds
2
Baths
1,736
Sq Ft
$238/Sq Ft
Est. Value
About This Home
This home is located at 319 Tourmaline Way, Redding, CA 96003 and is currently estimated at $412,617, approximately $237 per square foot. 319 Tourmaline Way is a home located in Shasta County with nearby schools including Turtle Bay, Sequoia Middle School, and Shasta High School.
Create a Home Valuation Report for This Property
The Home Valuation Report is an in-depth analysis detailing your home's value as well as a comparison with similar homes in the area
Home Values in the Area
Average Home Value in this Area
Tax History
We collect this data history from publicly available records. To have your information removed, we recommend requesting removal directly through your county’s website.
| Year | Tax Paid | Tax Assessment Tax Assessment Total Assessment is a certain percentage of the fair market value that is determined by local assessors to be the total taxable value of land and additions on the property. | Land | Improvement |
|---|---|---|---|---|
| 2025 | $2,075 | $198,909 | $37,071 | $161,838 |
| 2024 | $1,936 | $195,010 | $36,345 | $158,665 |
| 2023 | $1,936 | $180,991 | $35,633 | $145,358 |
| 2022 | $1,903 | $177,443 | $34,935 | $142,508 |
| 2021 | $1,894 | $173,964 | $34,250 | $139,714 |
| 2020 | $1,919 | $172,181 | $33,899 | $138,282 |
| 2019 | $1,822 | $168,806 | $33,235 | $135,571 |
| 2018 | $1,838 | $165,497 | $32,584 | $132,913 |
| 2017 | $1,828 | $162,253 | $31,946 | $130,307 |
| 2016 | $1,770 | $159,072 | $31,320 | $127,752 |
| 2015 | $1,748 | $156,684 | $30,850 | $125,834 |
| 2014 | $1,736 | $153,616 | $30,246 | $123,370 |
Source: Public Records
Map
Nearby Homes
- 2661 Snow Ln
- 2520 Snow Ln
- 490 Turquoise Ct
- 3164 Harlan Dr
- 784 Lakeview Dr
- 416 Arbor Place
- 531 Aurora Place
- 582 River Oaks Dr
- 2351 Eureka Way
- 1834 Del Mar Ave
- 1129 Magnolia Ave
- 1170 Orange Ave
- 866 Palatine Ct
- 370 River Park Dr
- 2255 North St
- 1465 Riverside Dr
- 1010 California St
- 1933 Eureka Way
- 3410 Scenic Dr
- 3360 Stanford Dr
- 249 Tourmaline Way
- 287 Tourmaline Way Unit 1
- 287 Tourmaline Way
- 2682 Amethyst Way
- 2634 Amethyst Way
- 2580 Amethyst Way
- 264 Tourmaline Way
- 2550 Amethyst Way
- 236 Tourmaline Way Unit 1
- 236 Tourmaline Way
- 288 Tourmaline Way Unit 1
- 2520 Amethyst Way
- 347 Tourmaline Way Unit 1A
- 2736 Amethyst Way
- 308 Tourmaline Way
- 2651 Amethyst Way
- 2673 Amethyst Way
- 2629 Amethyst Way
- 2695 Amethyst Way
- 2607 Amethyst Way
Your Personal Tour Guide
Ask me questions while you tour the home.