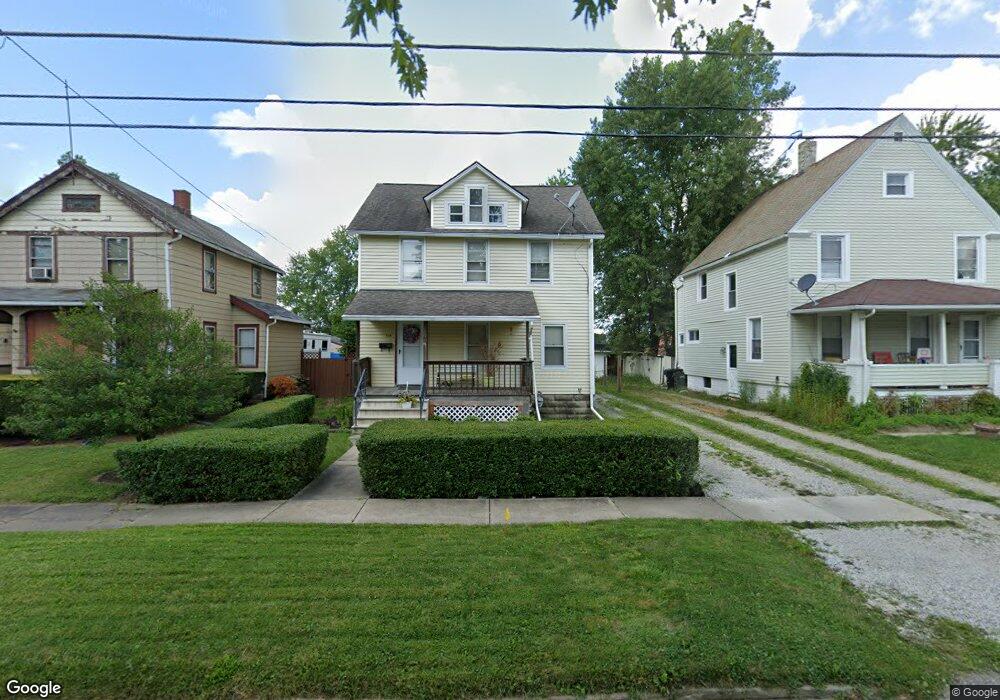
319 Winckles St Elyria, OH 44035
Estimated Value: $117,368 - $149,000
3
Beds
1
Bath
1,248
Sq Ft
$107/Sq Ft
Est. Value
About This Home
This home is located at 319 Winckles St, Elyria, OH 44035 and is currently estimated at $133,842, approximately $107 per square foot. 319 Winckles St is a home located in Lorain County with nearby schools including Eastern Heights Middle School, Elyria High School, and Constellation Schools: Elyria Community Elementary.
Ownership History
Date
Name
Owned For
Owner Type
Purchase Details
Closed on
Mar 22, 2018
Sold by
Johnson Thomas and Johnson Kerri L
Bought by
Palider Stacy
Current Estimated Value
Home Financials for this Owner
Home Financials are based on the most recent Mortgage that was taken out on this home.
Original Mortgage
$63,822
Outstanding Balance
$56,753
Interest Rate
6.12%
Mortgage Type
FHA
Estimated Equity
$77,089
Purchase Details
Closed on
Mar 4, 2011
Sold by
Johnson Thomas
Bought by
Johnson Thomas and Johnson Kerri L
Purchase Details
Closed on
Nov 12, 2008
Sold by
Dollar Bank Fsb
Bought by
Johnson Thomas
Purchase Details
Closed on
Sep 17, 2008
Sold by
Gallogly Jamie B
Bought by
Dollar Bank
Purchase Details
Closed on
Jun 12, 1998
Sold by
Hud
Bought by
Gallogly Jamie B
Home Financials for this Owner
Home Financials are based on the most recent Mortgage that was taken out on this home.
Original Mortgage
$61,450
Interest Rate
7.22%
Mortgage Type
FHA
Create a Home Valuation Report for This Property
The Home Valuation Report is an in-depth analysis detailing your home's value as well as a comparison with similar homes in the area
Home Values in the Area
Average Home Value in this Area
Purchase History
| Date | Buyer | Sale Price | Title Company |
|---|---|---|---|
| Palider Stacy | $65,000 | Miller Home Title | |
| Johnson Thomas | -- | None Available | |
| Johnson Thomas | $32,500 | Ohio Title Corporation | |
| Dollar Bank | $56,000 | None Available | |
| Gallogly Jamie B | -- | Gateway Title Agency Inc |
Source: Public Records
Mortgage History
| Date | Status | Borrower | Loan Amount |
|---|---|---|---|
| Open | Palider Stacy | $63,822 | |
| Previous Owner | Gallogly Jamie B | $61,450 |
Source: Public Records
Tax History
| Year | Tax Paid | Tax Assessment Tax Assessment Total Assessment is a certain percentage of the fair market value that is determined by local assessors to be the total taxable value of land and additions on the property. | Land | Improvement |
|---|---|---|---|---|
| 2024 | $1,666 | $35,196 | $4,998 | $30,198 |
| 2023 | $1,732 | $31,780 | $7,168 | $24,612 |
| 2022 | $1,726 | $31,780 | $7,168 | $24,612 |
| 2021 | $1,730 | $31,780 | $7,170 | $24,610 |
| 2020 | $1,663 | $27,180 | $6,130 | $21,050 |
| 2019 | $1,653 | $27,180 | $6,130 | $21,050 |
| 2018 | $1,648 | $27,180 | $6,130 | $21,050 |
| 2017 | $1,598 | $24,560 | $6,400 | $18,160 |
| 2016 | $1,578 | $24,560 | $6,400 | $18,160 |
| 2015 | $1,481 | $24,560 | $6,400 | $18,160 |
| 2014 | $1,449 | $24,310 | $6,330 | $17,980 |
| 2013 | $1,437 | $24,310 | $6,330 | $17,980 |
Source: Public Records
Map
Nearby Homes
- 453 Kenyon Ave
- 355 Kenyon Ave
- 209 Clark St
- 347 Kenyon Ave
- 805 Clark St
- 171 S Logan St
- 340 Boston Ave
- 123 Harwood St
- 164 Woodbury St
- 708 Park Ave
- 144 Roosevelt Ave
- 147 Hamilton St
- 800 Boston Ave
- 914 Garford Ave
- 7 Smith Ct
- 817 Boston Ave
- 120 Longford Ave
- 147 Bellfield Ave
- 137 Lafayette St
- 549 Delaware Ave
- 321 Winckles St
- 315 Winckles St
- 311 Winckles St
- 325 Winckles St
- 327 & 327-1/2 Winckles St
- 331 Winckles St
- 327 Winckles St
- 327 Winckles St
- 318 Prospect St
- 322 Prospect St
- 335 Winckles St
- 515 Clark St
- 515 Clark St
- 318 Winckles St
- 320 Winckles St
- 316 Winckles St
- 324 Winckles St
- 312 Winckles St
- 525 Clark St
- 337 Winckles St
Your Personal Tour Guide
Ask me questions while you tour the home.