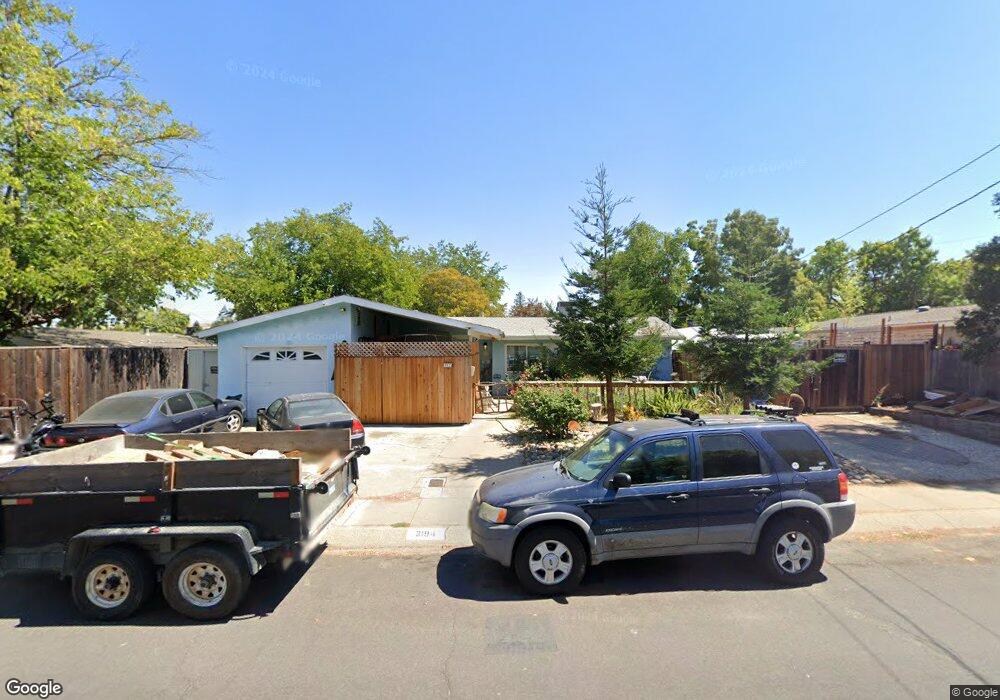
3194 Esperanza Dr Unit 4 Concord, CA 94519
Holbrook Heights NeighborhoodEstimated Value: $692,000 - $735,440
3
Beds
2
Baths
1,650
Sq Ft
$436/Sq Ft
Est. Value
About This Home
This home is located at 3194 Esperanza Dr Unit 4, Concord, CA 94519 and is currently estimated at $719,860, approximately $436 per square foot. 3194 Esperanza Dr Unit 4 is a home located in Contra Costa County with nearby schools including Holbrook Language Academy, El Dorado Middle School, and Mt. Diablo High School.
Ownership History
Date
Name
Owned For
Owner Type
Purchase Details
Closed on
Oct 20, 2016
Sold by
Newman Brian D and Newman Kimberly A
Bought by
Dadand Ron and Surya Ihdami Nancy H
Current Estimated Value
Home Financials for this Owner
Home Financials are based on the most recent Mortgage that was taken out on this home.
Original Mortgage
$235,000
Outstanding Balance
$188,157
Interest Rate
3.42%
Mortgage Type
New Conventional
Estimated Equity
$531,703
Purchase Details
Closed on
Jan 6, 2005
Sold by
Rodgers Ken
Bought by
Newman Brian D and Newman Kimberly A
Home Financials for this Owner
Home Financials are based on the most recent Mortgage that was taken out on this home.
Original Mortgage
$392,000
Interest Rate
6.12%
Mortgage Type
Purchase Money Mortgage
Create a Home Valuation Report for This Property
The Home Valuation Report is an in-depth analysis detailing your home's value as well as a comparison with similar homes in the area
Home Values in the Area
Average Home Value in this Area
Purchase History
| Date | Buyer | Sale Price | Title Company |
|---|---|---|---|
| Dadand Ron | $405,454 | Stewart Title Of Ca Inc | |
| Newman Brian D | $490,000 | Chicago Title |
Source: Public Records
Mortgage History
| Date | Status | Borrower | Loan Amount |
|---|---|---|---|
| Open | Dadand Ron | $235,000 | |
| Previous Owner | Newman Brian D | $392,000 | |
| Closed | Newman Brian D | $98,000 |
Source: Public Records
Tax History Compared to Growth
Tax History
| Year | Tax Paid | Tax Assessment Tax Assessment Total Assessment is a certain percentage of the fair market value that is determined by local assessors to be the total taxable value of land and additions on the property. | Land | Improvement |
|---|---|---|---|---|
| 2025 | $6,602 | $522,258 | $348,173 | $174,085 |
| 2024 | $6,473 | $512,019 | $341,347 | $170,672 |
| 2023 | $6,473 | $501,980 | $334,654 | $167,326 |
| 2022 | $6,381 | $492,139 | $328,093 | $164,046 |
| 2021 | $6,222 | $482,490 | $321,660 | $160,830 |
| 2019 | $6,100 | $468,180 | $312,120 | $156,060 |
| 2018 | $5,867 | $459,000 | $306,000 | $153,000 |
| 2017 | $5,670 | $450,000 | $300,000 | $150,000 |
| 2016 | $4,946 | $390,000 | $246,735 | $143,265 |
| 2015 | $4,150 | $318,500 | $201,500 | $117,000 |
| 2014 | $3,381 | $251,500 | $159,112 | $92,388 |
Source: Public Records
Map
Nearby Homes
- 3191 Hillview Ct
- 3188 Fitzpatrick Dr
- 2109 Roskelley Dr
- 3167 Hacienda Dr
- 3119 Meadowbrook Dr
- 2425 Jerilynn Dr
- 3336 Claudia Dr
- 3249 Claudia Dr
- 2626 Prestwick Ave
- 3025 Laurence Ct
- 3166 Salvio St
- 3425 Dormer Ave
- 3412 Flamingo Dr
- 3478 Esperanza Dr
- 2445 Maple Ave
- 1920 Encima Dr
- 3025 Gratton Way
- 1985 N 3rd St
- 1930 N 6th St
- 2250 Hickory Dr
- 2171 N 6th St
- 2176 Roskelley Dr
- 2169 N 6th St
- 2172 Roskelley Dr
- 2165 N 6th St
- 3195 Esperanza Dr
- 3191 Esperanza Dr
- 2168 Roskelley Dr
- 3187 Esperanza Dr
- 2161 N 6th St
- 2176 N 6th St
- 3183 Esperanza Dr
- 2164 Roskelley Dr
- 2173 Roskelley Dr
- 2172 N 6th St
- 3190 Hillview Ct
- 3194 Hillview Ct
- 2168 N 6th St
- 3186 Hillview Ct
- 2205 N 6th St