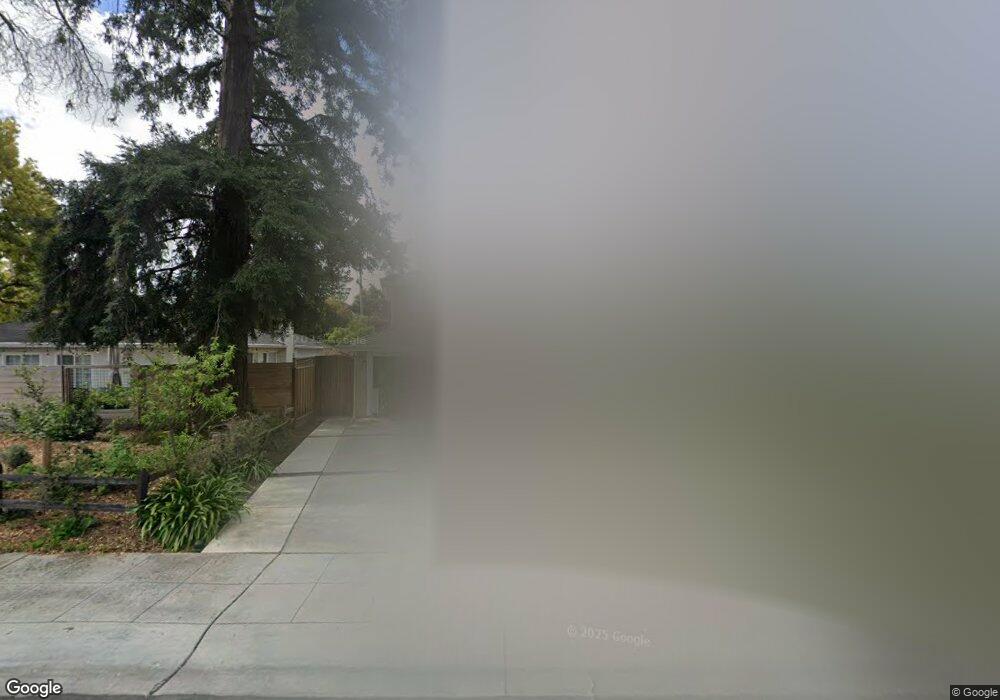
3194 South Ct Palo Alto, CA 94306
South of Midtown NeighborhoodEstimated Value: $3,473,000 - $4,535,000
4
Beds
2
Baths
1,613
Sq Ft
$2,509/Sq Ft
Est. Value
About This Home
This home is located at 3194 South Ct, Palo Alto, CA 94306 and is currently estimated at $4,047,435, approximately $2,509 per square foot. 3194 South Ct is a home located in Santa Clara County with nearby schools including El Carmelo Elementary School, Jane Lathrop Stanford Middle School, and Henry M. Gunn High School.
Ownership History
Date
Name
Owned For
Owner Type
Purchase Details
Closed on
Aug 11, 2011
Sold by
Scott Stephen
Bought by
Yi Ju Hyong and Kim Sung Ok
Current Estimated Value
Home Financials for this Owner
Home Financials are based on the most recent Mortgage that was taken out on this home.
Original Mortgage
$729,000
Outstanding Balance
$503,808
Interest Rate
4.53%
Mortgage Type
New Conventional
Estimated Equity
$3,543,627
Purchase Details
Closed on
Jul 24, 1997
Sold by
Scott Carl R and Scott Catherine C
Bought by
Scott Carl Reid and Scott Catherine C
Create a Home Valuation Report for This Property
The Home Valuation Report is an in-depth analysis detailing your home's value as well as a comparison with similar homes in the area
Home Values in the Area
Average Home Value in this Area
Purchase History
| Date | Buyer | Sale Price | Title Company |
|---|---|---|---|
| Yi Ju Hyong | $1,393,000 | Old Republic Title Company | |
| Scott Carl Reid | -- | -- |
Source: Public Records
Mortgage History
| Date | Status | Borrower | Loan Amount |
|---|---|---|---|
| Open | Yi Ju Hyong | $729,000 |
Source: Public Records
Tax History Compared to Growth
Tax History
| Year | Tax Paid | Tax Assessment Tax Assessment Total Assessment is a certain percentage of the fair market value that is determined by local assessors to be the total taxable value of land and additions on the property. | Land | Improvement |
|---|---|---|---|---|
| 2025 | $29,847 | $2,511,166 | $1,507,262 | $1,003,904 |
| 2024 | $29,847 | $2,461,928 | $1,477,708 | $984,220 |
| 2023 | $29,407 | $2,413,656 | $1,448,734 | $964,922 |
| 2022 | $29,065 | $2,366,330 | $1,420,328 | $946,002 |
| 2021 | $28,491 | $2,319,932 | $1,392,479 | $927,453 |
| 2020 | $27,903 | $2,296,145 | $1,378,201 | $917,944 |
| 2019 | $27,594 | $2,251,124 | $1,351,178 | $899,946 |
| 2018 | $26,835 | $2,206,985 | $1,324,685 | $882,300 |
| 2017 | $26,363 | $2,163,711 | $1,298,711 | $865,000 |
| 2016 | $25,672 | $2,121,287 | $1,273,247 | $848,040 |
| 2015 | $25,421 | $2,089,424 | $1,254,122 | $835,302 |
| 2014 | $24,904 | $2,048,496 | $1,229,556 | $818,940 |
Source: Public Records
Map
Nearby Homes
- 339 El Verano Ave
- 3213 Alma St
- 3428 Alma Village Cir
- 590 Ashton Ave
- 360 Fernando Ave
- 3585 El Camino Real
- 2760 Byron St
- 701 Christine Dr
- 2685 Cowper St
- 3888 Magnolia Dr
- 3 Plan at Acacia
- 2A Plan at Acacia
- 1 Plan at Acacia
- 5 Plan at Acacia
- 4X Plan at Acacia
- 2 Plan at Acacia
- 4 Plan at Acacia
- 4115 El Camino Real Unit 333
- 4115 El Camino Real Unit 331
- 4115 El Camino Real Unit 222
- 3190 South Ct
- 329 Campesino Ave
- 3180 South Ct
- 3193 Bryant St
- 3189 Bryant St
- 305 Campesino Ave
- 330 Campesino Ave
- 3176 South Ct
- 3187 Bryant St
- 3181 Bryant St
- 359 Campesino Ave
- 3195 South Ct
- 3172 South Ct
- 3211 Bryant St
- 3193 South Ct
- 350 Campesino Ave
- 3179 Bryant St
- 3183 South Ct
- 3168 South Ct
- 3220 South Ct
