Estimated Value: $928,776 - $1,347,000
1
Bed
1
Bath
832
Sq Ft
$1,328/Sq Ft
Est. Value
About This Home
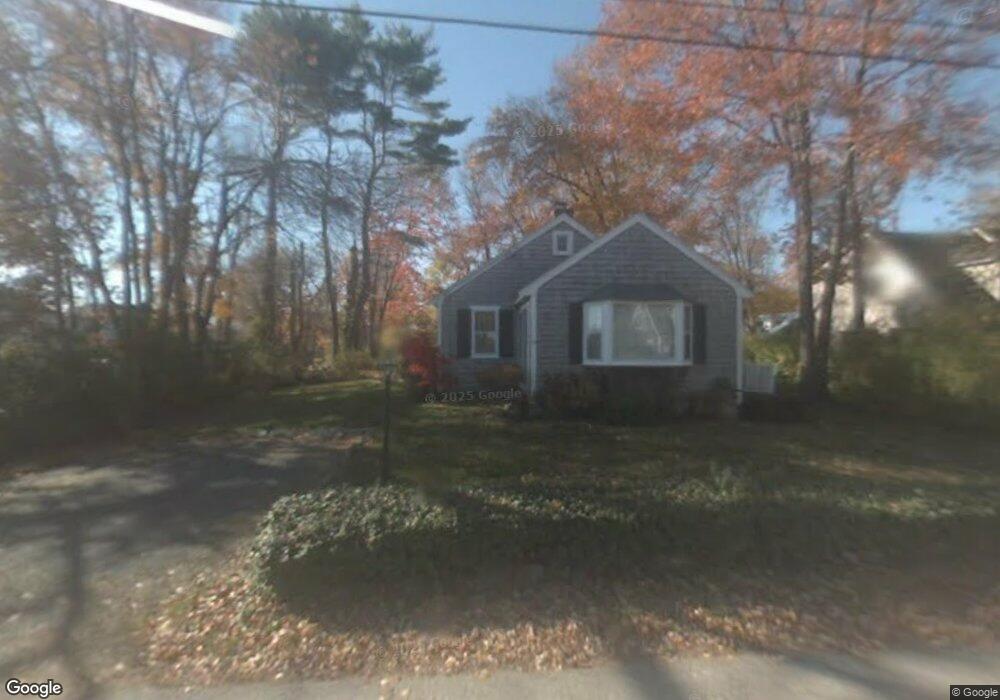
This home is located at 32 Baker Ave, Rye, NH 03870 and is currently estimated at $1,105,194, approximately $1,328 per square foot. 32 Baker Ave is a home located in Rockingham County with nearby schools including Rye Elementary School, Rye Junior High School, and Rye Country Day School.
Ownership History
Date
Name
Owned For
Owner Type
Purchase Details
Closed on
Apr 30, 2014
Sold by
Thornton Ft and Thornton Timothy M
Bought by
Thornton Kevin A and Thornton Bethany C
Current Estimated Value
Purchase Details
Closed on
Apr 12, 2006
Sold by
Dearden Helen Lousie
Bought by
Thornton Kevin A and Thornton Bethany C
Home Financials for this Owner
Home Financials are based on the most recent Mortgage that was taken out on this home.
Original Mortgage
$200,000
Interest Rate
6.28%
Mortgage Type
Purchase Money Mortgage
Create a Home Valuation Report for This Property
The Home Valuation Report is an in-depth analysis detailing your home's value as well as a comparison with similar homes in the area
Home Values in the Area
Average Home Value in this Area
Purchase History
| Date | Buyer | Sale Price | Title Company |
|---|---|---|---|
| Thornton Kevin A | -- | -- | |
| Thornton Kevin A | $440,000 | -- |
Source: Public Records
Mortgage History
| Date | Status | Borrower | Loan Amount |
|---|---|---|---|
| Previous Owner | Thornton Kevin A | $200,000 |
Source: Public Records
Tax History
| Year | Tax Paid | Tax Assessment Tax Assessment Total Assessment is a certain percentage of the fair market value that is determined by local assessors to be the total taxable value of land and additions on the property. | Land | Improvement |
|---|---|---|---|---|
| 2024 | $6,326 | $730,500 | $599,800 | $130,700 |
| 2023 | $5,866 | $730,500 | $599,800 | $130,700 |
| 2022 | $5,099 | $730,500 | $599,800 | $130,700 |
| 2021 | $5,185 | $507,300 | $445,800 | $61,500 |
| 2020 | $5,185 | $507,300 | $445,800 | $61,500 |
| 2019 | $5,185 | $507,300 | $445,800 | $61,500 |
| 2018 | $5,130 | $507,400 | $445,800 | $61,600 |
| 2017 | $5,130 | $507,400 | $445,800 | $61,600 |
| 2016 | $4,724 | $442,300 | $380,000 | $62,300 |
| 2013 | $4,849 | $442,000 | $380,000 | $62,000 |
Source: Public Records
Map
Nearby Homes
Your Personal Tour Guide
Ask me questions while you tour the home.