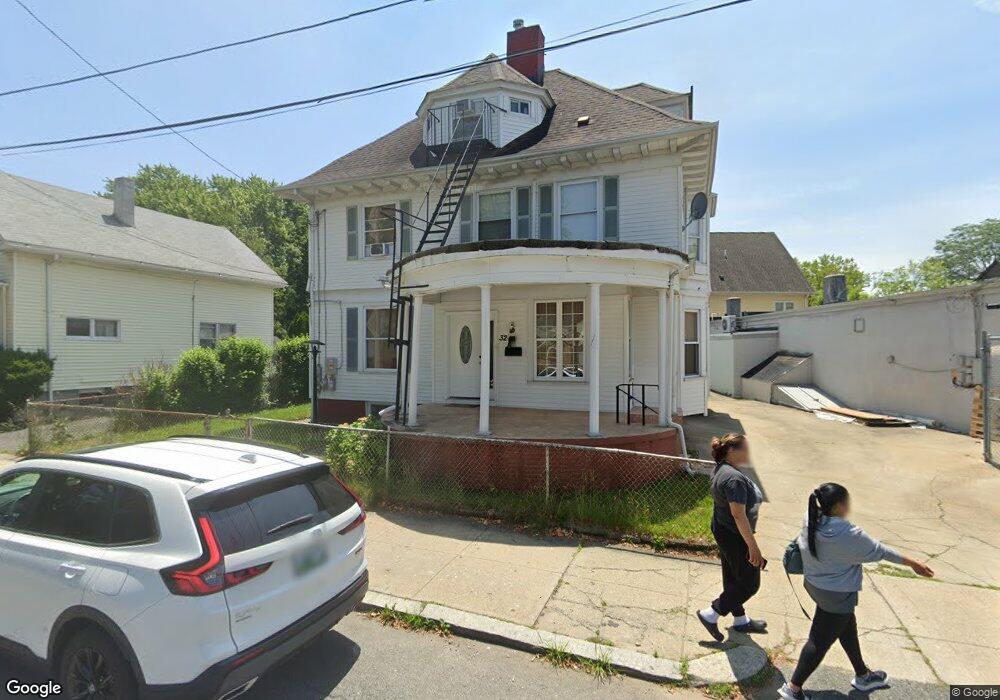
32 Calla St Providence, RI 02905
Washington Park NeighborhoodEstimated Value: $365,000 - $468,748
6
Beds
3
Baths
2,125
Sq Ft
$196/Sq Ft
Est. Value
About This Home
This home is located at 32 Calla St, Providence, RI 02905 and is currently estimated at $416,187, approximately $195 per square foot. 32 Calla St is a home located in Providence County with nearby schools including Highlander Charter School and The Hope Academy.
Ownership History
Date
Name
Owned For
Owner Type
Purchase Details
Closed on
Feb 10, 2011
Sold by
Greene Stephen
Bought by
Aracena Ardomis
Current Estimated Value
Purchase Details
Closed on
Mar 26, 2009
Sold by
Sutton Funding Llc
Bought by
Aracena Ardomis
Purchase Details
Closed on
Oct 27, 2008
Sold by
Polanco Sunny F
Bought by
Sutton Funding Llc
Purchase Details
Closed on
Oct 25, 2004
Sold by
Wilson Francia
Bought by
Guerraro Junior
Purchase Details
Closed on
Aug 20, 1999
Sold by
Jimenez Manuel
Bought by
Wilson Francia
Purchase Details
Closed on
May 13, 1996
Sold by
Kelly Thomas Joseph and Kelly Pamela
Bought by
Reynoso Pablo A and Reynoso Ana
Create a Home Valuation Report for This Property
The Home Valuation Report is an in-depth analysis detailing your home's value as well as a comparison with similar homes in the area
Home Values in the Area
Average Home Value in this Area
Purchase History
| Date | Buyer | Sale Price | Title Company |
|---|---|---|---|
| Aracena Ardomis | $5,618 | -- | |
| Aracena Ardomis | $42,000 | -- | |
| Sutton Funding Llc | $152,338 | -- | |
| Guerraro Junior | $175,000 | -- | |
| Wilson Francia | $73,000 | -- | |
| Reynoso Pablo A | $85,000 | -- |
Source: Public Records
Mortgage History
| Date | Status | Borrower | Loan Amount |
|---|---|---|---|
| Open | Reynoso Pablo A | $100,709 |
Source: Public Records
Tax History
| Year | Tax Paid | Tax Assessment Tax Assessment Total Assessment is a certain percentage of the fair market value that is determined by local assessors to be the total taxable value of land and additions on the property. | Land | Improvement |
|---|---|---|---|---|
| 2025 | $3,302 | $393,100 | $121,500 | $271,600 |
| 2024 | $5,147 | $280,500 | $77,000 | $203,500 |
| 2023 | $5,147 | $280,500 | $77,000 | $203,500 |
| 2022 | $4,993 | $280,500 | $77,000 | $203,500 |
| 2021 | $4,219 | $171,800 | $35,400 | $136,400 |
| 2020 | $4,219 | $171,800 | $35,400 | $136,400 |
| 2019 | $4,219 | $171,800 | $35,400 | $136,400 |
| 2018 | $4,232 | $132,400 | $32,200 | $100,200 |
| 2017 | $4,232 | $132,400 | $32,200 | $100,200 |
| 2016 | $4,232 | $132,400 | $32,200 | $100,200 |
| 2015 | $3,893 | $117,600 | $32,200 | $85,400 |
| 2014 | $3,969 | $117,600 | $32,200 | $85,400 |
| 2013 | $3,969 | $117,600 | $32,200 | $85,400 |
Source: Public Records
Map
Nearby Homes
- 55 Homer St
- 77 Payton St
- 52 Cactus St
- 183 Baker St
- 61 Cyr St
- 286 California Ave
- 255 Ohio Ave
- 139 Babcock St
- 390 Montgomery Ave
- 162 Verndale Ave
- 233 California Ave
- 273 Montgomery Ave
- 208 California Ave
- 274 Montgomery Ave
- 358 Northup St
- 180 Ohio Ave
- 325 Northup St
- 133 Byfield St
- 160 Ohio Ave
- 31 Sassafras St
Your Personal Tour Guide
Ask me questions while you tour the home.