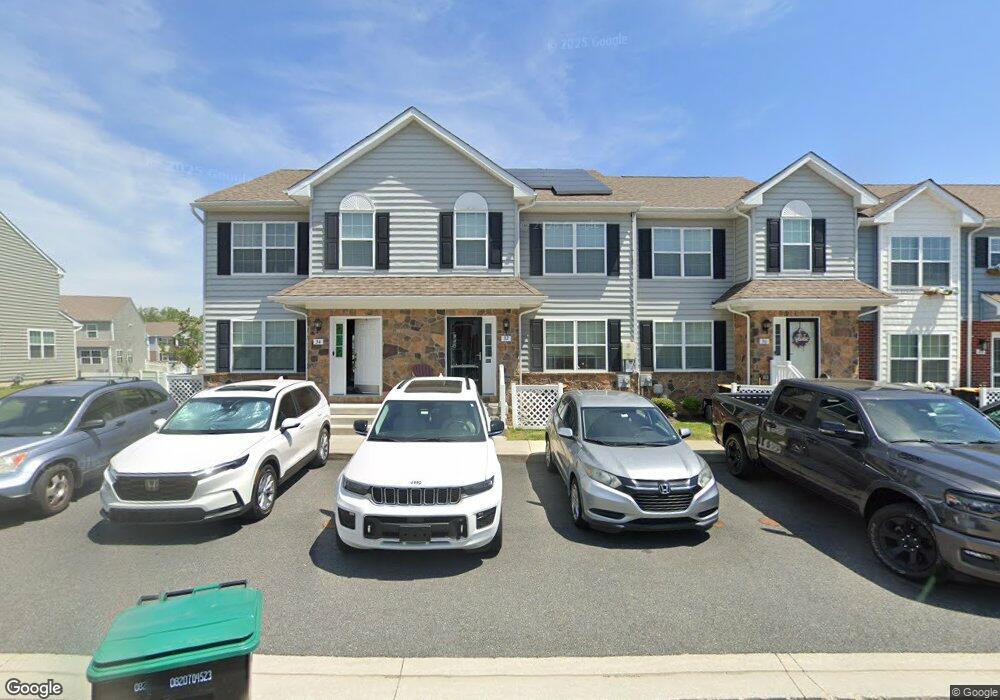
32 Cambria Ln Smyrna, DE 19977
Estimated Value: $300,000 - $323,195
3
Beds
3
Baths
1,506
Sq Ft
$206/Sq Ft
Est. Value
About This Home
This home is located at 32 Cambria Ln, Smyrna, DE 19977 and is currently estimated at $310,549, approximately $206 per square foot. 32 Cambria Ln is a home with nearby schools including Smyrna Elementary School, John Bassett Moore Intermediate School, and Smyrna Middle School.
Ownership History
Date
Name
Owned For
Owner Type
Purchase Details
Closed on
Aug 27, 2025
Sold by
Reeves Brittany L and Rothfus Pamela
Bought by
Reeves Brittany
Current Estimated Value
Home Financials for this Owner
Home Financials are based on the most recent Mortgage that was taken out on this home.
Original Mortgage
$254,375
Outstanding Balance
$254,375
Interest Rate
6.74%
Mortgage Type
FHA
Estimated Equity
$56,174
Purchase Details
Closed on
Jun 22, 2020
Sold by
Lenape Development Inc
Bought by
Rothfus Pamela and Robinson Brittany L
Home Financials for this Owner
Home Financials are based on the most recent Mortgage that was taken out on this home.
Original Mortgage
$202,735
Interest Rate
3.2%
Mortgage Type
New Conventional
Purchase Details
Closed on
May 5, 2020
Sold by
Liborio Iii Lp
Bought by
Lenape Development Inc
Home Financials for this Owner
Home Financials are based on the most recent Mortgage that was taken out on this home.
Original Mortgage
$202,735
Interest Rate
3.2%
Mortgage Type
New Conventional
Create a Home Valuation Report for This Property
The Home Valuation Report is an in-depth analysis detailing your home's value as well as a comparison with similar homes in the area
Home Values in the Area
Average Home Value in this Area
Purchase History
| Date | Buyer | Sale Price | Title Company |
|---|---|---|---|
| Reeves Brittany | -- | None Listed On Document | |
| Rothfus Pamela | $209,005 | None Available | |
| Lenape Development Inc | -- | None Available |
Source: Public Records
Mortgage History
| Date | Status | Borrower | Loan Amount |
|---|---|---|---|
| Open | Reeves Brittany | $254,375 | |
| Previous Owner | Rothfus Pamela | $202,735 |
Source: Public Records
Tax History Compared to Growth
Tax History
| Year | Tax Paid | Tax Assessment Tax Assessment Total Assessment is a certain percentage of the fair market value that is determined by local assessors to be the total taxable value of land and additions on the property. | Land | Improvement |
|---|---|---|---|---|
| 2025 | $1,196 | $283,400 | $45,100 | $238,300 |
| 2024 | $1,196 | $283,400 | $45,100 | $238,300 |
| 2023 | $1,071 | $40,300 | $2,900 | $37,400 |
| 2022 | $1,021 | $40,300 | $2,900 | $37,400 |
| 2021 | $1,001 | $40,300 | $2,900 | $37,400 |
| 2020 | $63 | $2,900 | $2,900 | $0 |
| 2019 | $7 | $300 | $300 | $0 |
| 2018 | $7 | $300 | $300 | $0 |
| 2017 | $7 | $300 | $0 | $0 |
| 2016 | $7 | $300 | $0 | $0 |
| 2015 | $7 | $300 | $0 | $0 |
| 2014 | $6 | $300 | $0 | $0 |
Source: Public Records
Map
Nearby Homes
- 89 Salerno Dr
- 87 Salerno Dr
- 108 Salerno Dr
- 91 Toscano Dr
- 106 Salerno Dr
- 42 Salerno Dr
- 32 Salerno Dr
- 66 Mischief Ln
- 48 Lydia Dr
- 546 Barley Ct
- 671 Widener Ln
- 675 Widener Ln
- 717 Saks St Unit 84
- 63 Raphael Rd
- 14 Gorgons Ave
- 187 Hemlock Way Unit 187
- 35 Liborio Ln
- 8 Aidone Ln
- 128 Ivy Ridge Ct Unit 128
- 182 182-B Hemlock Way Unit 276