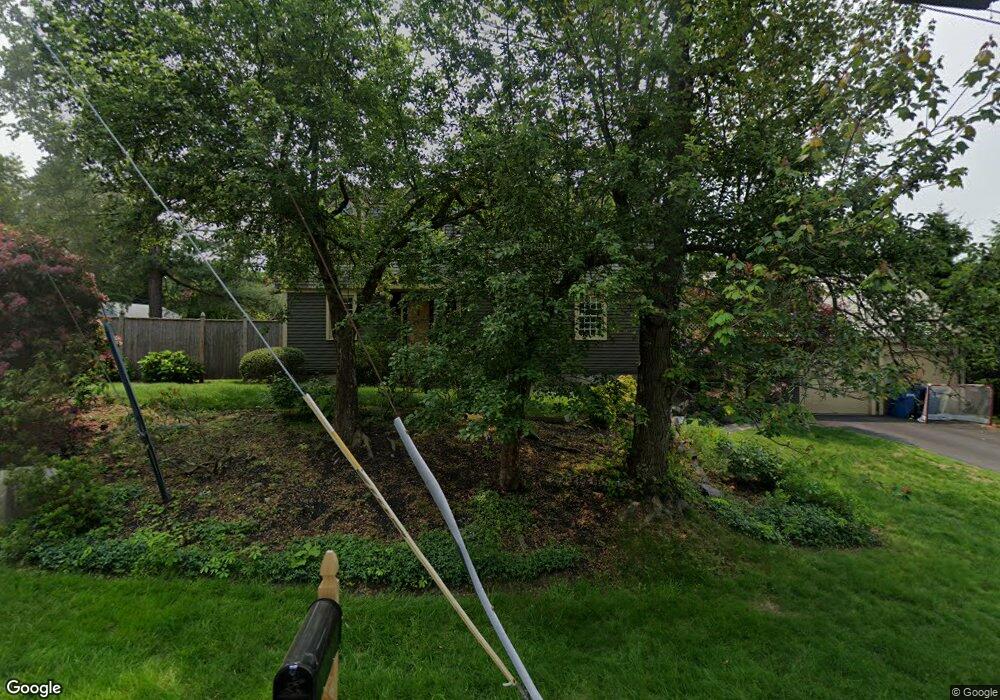
32 Cedarcrest Rd Canton, MA 02021
Estimated Value: $840,000 - $916,000
3
Beds
4
Baths
1,893
Sq Ft
$471/Sq Ft
Est. Value
About This Home
This home is located at 32 Cedarcrest Rd, Canton, MA 02021 and is currently estimated at $891,287, approximately $470 per square foot. 32 Cedarcrest Rd is a home located in Norfolk County with nearby schools including Canton High School, St. John the Evangelist School, and Beacon Scholastic Academy.
Ownership History
Date
Name
Owned For
Owner Type
Purchase Details
Closed on
Jul 1, 2021
Sold by
G P & P A Cereno Lt and Cereno
Bought by
Cereno Patricia A
Current Estimated Value
Home Financials for this Owner
Home Financials are based on the most recent Mortgage that was taken out on this home.
Original Mortgage
$367,394
Interest Rate
5.3%
Mortgage Type
Stand Alone Refi Refinance Of Original Loan
Purchase Details
Closed on
Nov 5, 2013
Sold by
Cereno Gordon P and Cereno Patricia A
Bought by
F P & P A Cereno Lt
Purchase Details
Closed on
Apr 2, 2012
Sold by
Cereno Gordon P and Cereno Patricia A
Bought by
Cereno Gordon P and Cereno Patricia A
Purchase Details
Closed on
May 16, 2006
Sold by
Cereno Gordon P and Cereno Patricia A
Bought by
Cereno Gordon P and Cereno Patricia A
Create a Home Valuation Report for This Property
The Home Valuation Report is an in-depth analysis detailing your home's value as well as a comparison with similar homes in the area
Home Values in the Area
Average Home Value in this Area
Purchase History
| Date | Buyer | Sale Price | Title Company |
|---|---|---|---|
| Cereno Patricia A | -- | None Available | |
| F P & P A Cereno Lt | -- | -- | |
| Cereno Gordon P | -- | -- | |
| Cereno Gordon P | -- | -- | |
| Cereno Patricia A | -- | -- | |
| F P & P A Cereno Lt | -- | -- | |
| Cereno Gordon P | -- | -- | |
| Cereno Gordon P | -- | -- |
Source: Public Records
Mortgage History
| Date | Status | Borrower | Loan Amount |
|---|---|---|---|
| Previous Owner | Cereno Patricia A | $367,394 | |
| Previous Owner | Cereno Gordon P | $79,255 | |
| Previous Owner | Cereno Gordon P | $213,000 | |
| Previous Owner | Cereno Gordon P | $40,351 |
Source: Public Records
Tax History
| Year | Tax Paid | Tax Assessment Tax Assessment Total Assessment is a certain percentage of the fair market value that is determined by local assessors to be the total taxable value of land and additions on the property. | Land | Improvement |
|---|---|---|---|---|
| 2025 | $7,986 | $807,500 | $357,200 | $450,300 |
| 2024 | $7,802 | $782,500 | $343,500 | $439,000 |
| 2023 | $7,576 | $716,700 | $343,500 | $373,200 |
| 2022 | $7,287 | $642,000 | $327,100 | $314,900 |
| 2021 | $7,143 | $585,500 | $297,400 | $288,100 |
| 2020 | $6,823 | $557,900 | $283,200 | $274,700 |
| 2019 | $6,687 | $539,300 | $257,400 | $281,900 |
| 2018 | $6,488 | $522,400 | $247,500 | $274,900 |
| 2017 | $6,555 | $512,500 | $242,700 | $269,800 |
| 2016 | $6,398 | $500,200 | $236,700 | $263,500 |
| 2015 | $6,242 | $486,900 | $229,900 | $257,000 |
Source: Public Records
Map
Nearby Homes
- 36 Cedarcrest Rd
- 22 Oakdale Rd
- 42 Oakdale Rd
- 74 Cedarcrest Rd
- 78 Cedarcrest Rd
- 9 Evergreen Cir
- 26 Pequit St
- 399 Neponset St Unit 106
- 399 Neponset St Unit 408
- 399 Neponset St Unit 411
- 399 Neponset St Unit 103
- 399 Neponset St Unit 105
- 399 Neponset St Unit 405
- 399 Neponset St Unit 301
- 399 Neponset St Unit 101
- 399 Neponset St Unit 310
- 399 Neponset St Unit 206
- 399 Neponset St Unit 202
- 399 Neponset St Unit 211
- 399 Neponset St Unit 209
Your Personal Tour Guide
Ask me questions while you tour the home.