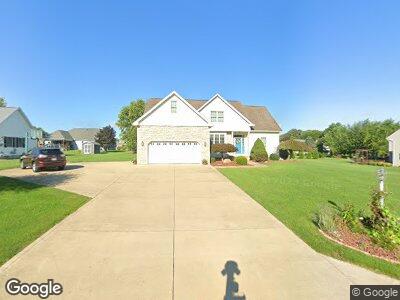
32 Cherdon Cir Wakeman, OH 44889
Estimated Value: $233,000 - $335,000
3
Beds
3
Baths
1,704
Sq Ft
$177/Sq Ft
Est. Value
About This Home
This home is located at 32 Cherdon Cir, Wakeman, OH 44889 and is currently estimated at $300,981, approximately $176 per square foot. 32 Cherdon Cir is a home located in Huron County with nearby schools including Western Reserve Elementary School, Western Reserve Middle School, and Western Reserve High School.
Ownership History
Date
Name
Owned For
Owner Type
Purchase Details
Closed on
Jun 4, 2021
Sold by
Chafin Darryl G
Bought by
Weimer Tamara
Current Estimated Value
Home Financials for this Owner
Home Financials are based on the most recent Mortgage that was taken out on this home.
Original Mortgage
$212,000
Outstanding Balance
$194,841
Interest Rate
2.9%
Mortgage Type
New Conventional
Estimated Equity
$111,655
Purchase Details
Closed on
Dec 26, 2018
Sold by
Crum Tania and Chafin Tania M
Bought by
Chafin Darryl G
Home Financials for this Owner
Home Financials are based on the most recent Mortgage that was taken out on this home.
Original Mortgage
$127,006
Interest Rate
4.5%
Mortgage Type
Future Advance Clause Open End Mortgage
Purchase Details
Closed on
Jul 23, 2003
Bought by
Chafin Darryl G and Chafin Tania M
Purchase Details
Closed on
Nov 21, 1997
Bought by
Fannin Brothers Inc
Create a Home Valuation Report for This Property
The Home Valuation Report is an in-depth analysis detailing your home's value as well as a comparison with similar homes in the area
Home Values in the Area
Average Home Value in this Area
Purchase History
| Date | Buyer | Sale Price | Title Company |
|---|---|---|---|
| Weimer Tamara | $265,000 | Accommodation | |
| Chafin Darryl G | $7,000 | None Available | |
| Chafin Darryl G | $25,000 | -- | |
| Fannin Brothers Inc | -- | -- |
Source: Public Records
Mortgage History
| Date | Status | Borrower | Loan Amount |
|---|---|---|---|
| Open | Weimer Tamara | $212,000 | |
| Previous Owner | Chafin Darryl G | $127,006 |
Source: Public Records
Tax History Compared to Growth
Tax History
| Year | Tax Paid | Tax Assessment Tax Assessment Total Assessment is a certain percentage of the fair market value that is determined by local assessors to be the total taxable value of land and additions on the property. | Land | Improvement |
|---|---|---|---|---|
| 2024 | $3,537 | $92,970 | $12,880 | $80,090 |
| 2023 | $3,537 | $77,430 | $11,150 | $66,280 |
| 2022 | $2,951 | $77,430 | $11,150 | $66,280 |
| 2021 | $3,038 | $77,430 | $11,150 | $66,280 |
| 2020 | $2,941 | $71,220 | $11,150 | $60,070 |
| 2019 | $2,930 | $71,220 | $11,150 | $60,070 |
| 2018 | $2,901 | $71,220 | $11,150 | $60,070 |
| 2017 | $2,669 | $66,160 | $11,150 | $55,010 |
| 2016 | $2,625 | $66,160 | $11,150 | $55,010 |
| 2015 | $2,781 | $66,170 | $11,160 | $55,010 |
| 2014 | $2,682 | $68,540 | $11,170 | $57,370 |
| 2013 | $2,596 | $68,540 | $11,170 | $57,370 |
Source: Public Records
Map
Nearby Homes
- 22 Cooper St
- 6175 U S 20
- 27 Deer Run Dr
- 5810 U S 20 Unit 91
- 5810 U S 20 Unit 120
- 5810 U S 20 Unit 157
- 5350 State Route 60
- 52356 Us Highway 20
- 2330 Saint Johns Rd
- 4647 Zenobia Rd
- 12904 Butler Rd
- 1658 Vesta Rd
- 523 Church St
- 15199 State Route 511
- 17681 State Route 511
- 1491 Vesta Rd
- 215 State St
- 10212 State Route 113 E
- 0 Sr 113 Unit 5103179
- 5194 Ferry Rd