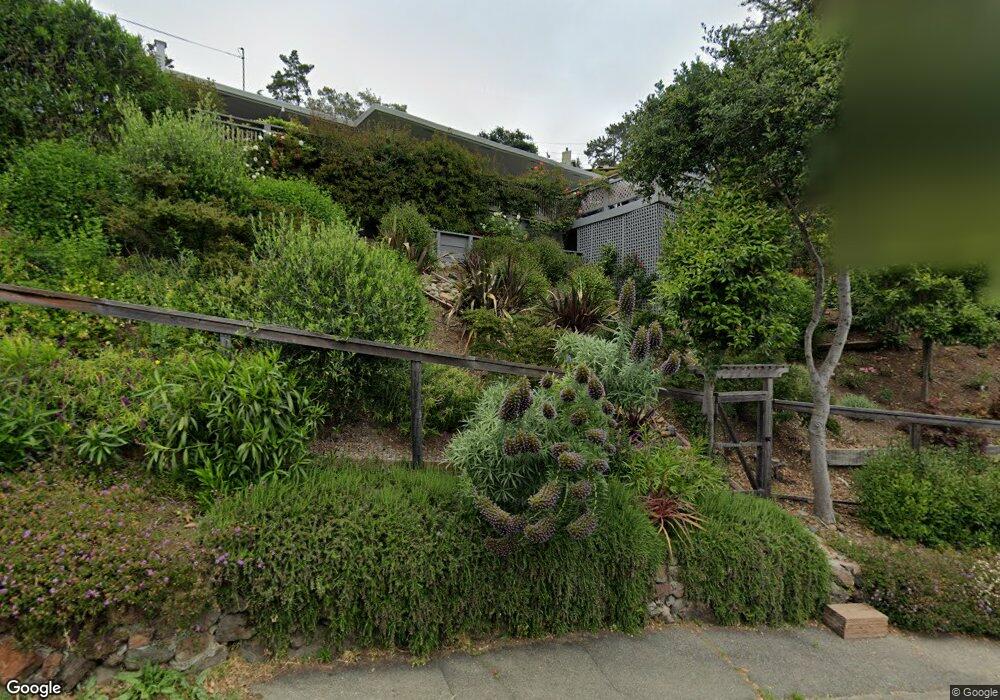
32 Chestnut Ave San Rafael, CA 94901
Sun Valley NeighborhoodEstimated Value: $1,399,000 - $1,504,000
3
Beds
2
Baths
1,720
Sq Ft
$844/Sq Ft
Est. Value
About This Home
This home is located at 32 Chestnut Ave, San Rafael, CA 94901 and is currently estimated at $1,451,933, approximately $844 per square foot. 32 Chestnut Ave is a home located in Marin County with nearby schools including Sun Valley Elementary School, James B. Davidson Middle School, and San Rafael High School.
Ownership History
Date
Name
Owned For
Owner Type
Purchase Details
Closed on
Oct 31, 2017
Sold by
Childerns Donna and Porto Stephen Dal
Bought by
Childern Donna and Porto Stephanie Dal
Current Estimated Value
Purchase Details
Closed on
Apr 16, 2009
Sold by
Childers Donna and Dal Porto Stephanie
Bought by
Childers Donna and Dal Porto Stephanie
Home Financials for this Owner
Home Financials are based on the most recent Mortgage that was taken out on this home.
Original Mortgage
$512,000
Outstanding Balance
$324,534
Interest Rate
4.99%
Mortgage Type
New Conventional
Estimated Equity
$1,127,399
Purchase Details
Closed on
Dec 29, 1998
Sold by
Beddard Edwin A
Bought by
Childers Donna and Dalporto Stephanie
Home Financials for this Owner
Home Financials are based on the most recent Mortgage that was taken out on this home.
Original Mortgage
$357,600
Interest Rate
6.87%
Create a Home Valuation Report for This Property
The Home Valuation Report is an in-depth analysis detailing your home's value as well as a comparison with similar homes in the area
Home Values in the Area
Average Home Value in this Area
Purchase History
| Date | Buyer | Sale Price | Title Company |
|---|---|---|---|
| Childern Donna | -- | None Available | |
| Childers Donna | -- | Orange Coast Title | |
| Childers Donna | $447,000 | First American Title Co |
Source: Public Records
Mortgage History
| Date | Status | Borrower | Loan Amount |
|---|---|---|---|
| Open | Childers Donna | $512,000 | |
| Closed | Childers Donna | $357,600 |
Source: Public Records
Tax History Compared to Growth
Tax History
| Year | Tax Paid | Tax Assessment Tax Assessment Total Assessment is a certain percentage of the fair market value that is determined by local assessors to be the total taxable value of land and additions on the property. | Land | Improvement |
|---|---|---|---|---|
| 2025 | $11,097 | $769,555 | $407,578 | $361,977 |
| 2024 | $11,097 | $754,469 | $399,588 | $354,881 |
| 2023 | $10,884 | $739,679 | $391,755 | $347,924 |
| 2022 | $10,306 | $725,178 | $384,074 | $341,104 |
| 2021 | $10,141 | $710,961 | $376,545 | $334,416 |
| 2020 | $10,027 | $703,672 | $372,684 | $330,988 |
| 2019 | $9,657 | $689,877 | $365,378 | $324,499 |
| 2018 | $9,558 | $676,352 | $358,215 | $318,137 |
| 2017 | $9,201 | $663,092 | $351,192 | $311,900 |
| 2016 | $8,889 | $650,093 | $344,307 | $305,786 |
| 2015 | $8,496 | $640,330 | $339,136 | $301,194 |
| 2014 | $8,140 | $627,787 | $332,493 | $295,294 |
Source: Public Records
Map
Nearby Homes
- 272 Center St
- 40 Leafwood Cir
- 241 Humboldt St
- 55 Bayo Vista Way
- 119 Oakmont Ave
- 16 Oakmont Ave
- 48 Ranch Rd
- 2323 5th Ave
- 2016 4th St
- 65 Circle Rd
- 51 El Camino Ave
- 29 Red Rock Way
- 31 Indian Rd
- 0 Chula Vista Dr Unit 325048501
- 0 Chula Vista Dr Unit 325048505
- 0 Chula Vista Dr Unit 325048499
- 0 Chula Vista Dr Unit 325048503
- 0 Chula Vista Dr Unit 325048502
- 0 Chula Vista Dr Unit 325048500
- 0 Chula Vista Dr Unit 325048504
- 70 Windsor Ave
- 61 Windsor Ave
- 99 Windsor Ave
- 37 Chestnut Ave
- 33 Chestnut Ave
- 29 Chestnut Ave
- 74 Windsor Ave
- 20 Chestnut Ave
- 41 Chestnut Ave
- 94 Windsor Ave
- 101 Windsor Ave
- 98 Windsor Ave
- 23 Chestnut Ave
- 418 Forbes Ave
- 45 Chestnut Ave
- 416 Forbes Ave
- 412 Forbes Ave
- 424 Forbes Ave
- 90 Windsor Ave
- 16 Chestnut Ave