
D
Seller's Agent in 2025
DYAN DEE DOLESE
KELLER WILLIAMS SUBURBAN REALTY
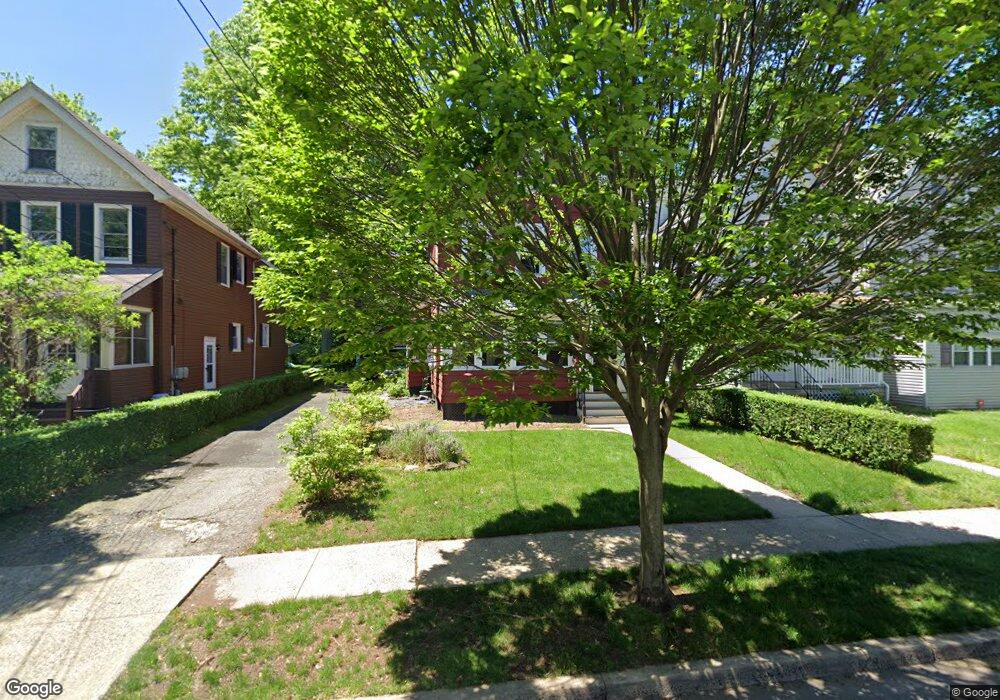
This home is located at 32 Clinton St, Bloomfield, NJ 07003 and is currently priced at $775,000, approximately $527 per square foot. This property was built in 1885. 32 Clinton St is a home located in Essex County with nearby schools including Watsessing Elementary School, Bloomfield Middle School, and Bloomfield High School.
Last Agent to Sell the Property
DYAN DEE DOLESE
KELLER WILLIAMS SUBURBAN REALTY Brokerage Phone: 973-251-0100 Listed on: 06/18/2025
| Date | Type | Sale Price | Title Company |
|---|---|---|---|
| Bargain Sale Deed | $775,000 | Clear Skies Title | |
| Deed | $308,000 | Chicago Title Insurance Co | |
| Deed | $299,000 | -- | |
| Deed | $221,000 | -- |
| Date | Status | Loan Amount | Loan Type |
|---|---|---|---|
| Open | $658,750 | New Conventional | |
| Previous Owner | $277,200 | New Conventional | |
| Previous Owner | $239,200 | No Value Available | |
| Previous Owner | $198,900 | No Value Available |
| Date | Event | Price | List to Sale | Price per Sq Ft |
|---|---|---|---|---|
| 08/15/2025 08/15/25 | Sold | $775,000 | +14.1% | $528 / Sq Ft |
| 07/04/2025 07/04/25 | Pending | -- | -- | -- |
| 06/18/2025 06/18/25 | For Sale | $679,000 | -- | $462 / Sq Ft |
| Year | Tax Paid | Tax Assessment Tax Assessment Total Assessment is a certain percentage of the fair market value that is determined by local assessors to be the total taxable value of land and additions on the property. | Land | Improvement |
|---|---|---|---|---|
| 2025 | $11,199 | $342,700 | $172,600 | $170,100 |
| 2024 | $11,199 | $342,700 | $172,600 | $170,100 |
| 2022 | $10,771 | $342,700 | $172,600 | $170,100 |
| 2021 | $10,771 | $342,700 | $172,600 | $170,100 |
| 2020 | $10,607 | $342,700 | $172,600 | $170,100 |
| 2019 | $11,051 | $277,600 | $135,000 | $142,600 |
| 2018 | $11,004 | $277,600 | $135,000 | $142,600 |
| 2017 | $10,838 | $277,600 | $135,000 | $142,600 |
| 2016 | $10,715 | $277,600 | $135,000 | $142,600 |
| 2015 | $10,618 | $277,600 | $135,000 | $142,600 |
| 2014 | $10,424 | $277,600 | $135,000 | $142,600 |
D
Seller's Agent in 2025
DYAN DEE DOLESE
KELLER WILLIAMS SUBURBAN REALTY
W
Buyer's Agent in 2025
WILLIAM KENNY KWONG
EXP REALTY, LLC
(908) 590-1257
1 in this area
65 Total Sales
Source: Garden State MLS
MLS Number: 3970254
APN: 02-00212-0000-00022
Disclaimer: Certain information contained herein is derived from information provided by parties other than Homes.com. All information provided is deemed reliable, but is not guaranteed to be accurate and should be independently verified.
![]() The data relating to real estate for sale on this website comes in part from the IDX Program of Garden State Multiple Listing Service, L.L.C. Real estate listings held by other brokerage firms are marked as IDX Listing.
The data relating to real estate for sale on this website comes in part from the IDX Program of Garden State Multiple Listing Service, L.L.C. Real estate listings held by other brokerage firms are marked as IDX Listing.
Information deemed reliable but not guaranteed.
Copyright © 2025 Garden State Multiple Listing Service, L.L.C. All rights reserved.
Notice: The dissemination of listings on this website does not constitute the consent required by N.J.A.C. 11:5.6.1 (n) for the advertisement of listings exclusively for sale by another broker. Any such consent must be obtained in writing from the listing broker.
This information is being provided for Consumers’ personal, non-commercial use and may not be used for any purpose other than to identify prospective properties Consumers may be interested in purchasing.