Estimated Value: $1,085,152 - $1,653,000
5
Beds
3
Baths
2,916
Sq Ft
$450/Sq Ft
Est. Value
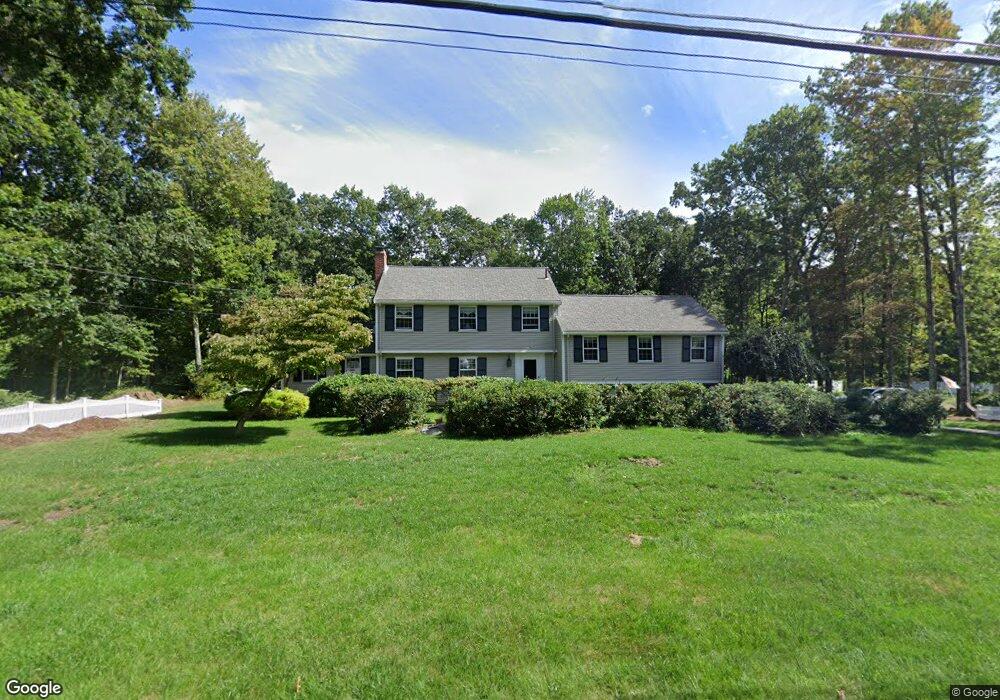
About This Home
This home is located at 32 Crest Dr, Dover, MA 02030 and is currently estimated at $1,311,288, approximately $449 per square foot. 32 Crest Dr is a home located in Norfolk County with nearby schools including Chickering Elementary School, Dover-Sherborn Regional Middle School, and Dover-Sherborn Regional High School.
Ownership History
Date
Name
Owned For
Owner Type
Purchase Details
Closed on
Dec 11, 2012
Sold by
Conley Kevin R and Conley Carol A
Bought by
Carol A Conley Ret and Conley Carol A
Current Estimated Value
Purchase Details
Closed on
Sep 22, 1992
Sold by
Goodsell Alice F
Bought by
Conley Kevin R and Conley Carol A
Home Financials for this Owner
Home Financials are based on the most recent Mortgage that was taken out on this home.
Original Mortgage
$185,000
Interest Rate
8.04%
Mortgage Type
Purchase Money Mortgage
Create a Home Valuation Report for This Property
The Home Valuation Report is an in-depth analysis detailing your home's value as well as a comparison with similar homes in the area
Home Values in the Area
Average Home Value in this Area
Purchase History
| Date | Buyer | Sale Price | Title Company |
|---|---|---|---|
| Carol A Conley Ret | -- | -- | |
| Conley Kevin R | $330,000 | -- |
Source: Public Records
Mortgage History
| Date | Status | Borrower | Loan Amount |
|---|---|---|---|
| Previous Owner | Conley Kevin R | $100,000 | |
| Previous Owner | Conley Kevin R | $186,700 | |
| Previous Owner | Conley Kevin R | $185,000 |
Source: Public Records
Tax History
| Year | Tax Paid | Tax Assessment Tax Assessment Total Assessment is a certain percentage of the fair market value that is determined by local assessors to be the total taxable value of land and additions on the property. | Land | Improvement |
|---|---|---|---|---|
| 2025 | $11,627 | $1,031,700 | $599,000 | $432,700 |
| 2024 | $10,993 | $1,003,000 | $599,000 | $404,000 |
| 2023 | $10,750 | $881,900 | $522,700 | $359,200 |
| 2022 | $9,857 | $793,600 | $479,200 | $314,400 |
| 2021 | $10,500 | $814,600 | $479,200 | $335,400 |
| 2020 | $10,459 | $814,600 | $479,200 | $335,400 |
| 2019 | $10,533 | $814,600 | $479,200 | $335,400 |
| 2018 | $9,661 | $752,400 | $435,600 | $316,800 |
| 2017 | $9,951 | $762,500 | $435,600 | $326,900 |
| 2016 | $9,540 | $740,700 | $413,800 | $326,900 |
| 2015 | $9,407 | $740,700 | $413,800 | $326,900 |
Source: Public Records
Map
Nearby Homes
Your Personal Tour Guide
Ask me questions while you tour the home.