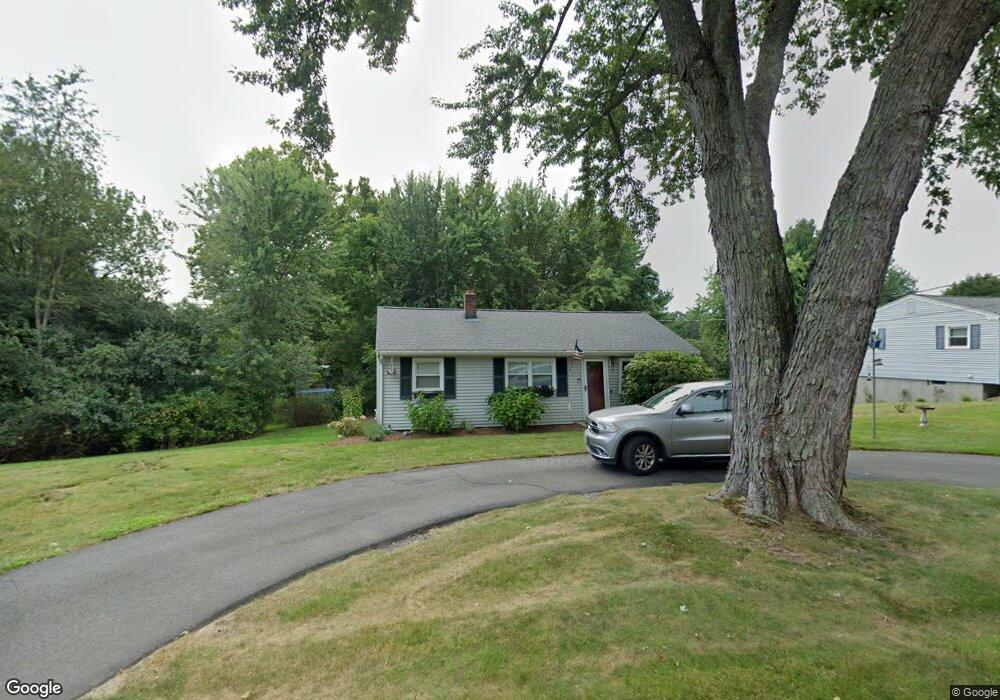
32 Elm St Franklin, MA 02038
Estimated Value: $469,389 - $580,000
3
Beds
1
Bath
864
Sq Ft
$585/Sq Ft
Est. Value
About This Home
This home is located at 32 Elm St, Franklin, MA 02038 and is currently estimated at $505,097, approximately $584 per square foot. 32 Elm St is a home located in Norfolk County with nearby schools including Helen Keller Elementary School, Annie Sullivan Middle School, and Franklin High School.
Ownership History
Date
Name
Owned For
Owner Type
Purchase Details
Closed on
Apr 30, 1998
Sold by
Conlin Richard F and Conlin Nicole R
Bought by
Chivallati Gary A and Chivallati Lauren E
Current Estimated Value
Purchase Details
Closed on
Jul 7, 1994
Sold by
Apex Heritage Property
Bought by
Conlin Richard F and Conlin Nicole R
Purchase Details
Closed on
Nov 19, 1992
Sold by
Goodwin Steven
Bought by
Peoples Heritage Bk
Create a Home Valuation Report for This Property
The Home Valuation Report is an in-depth analysis detailing your home's value as well as a comparison with similar homes in the area
Purchase History
| Date | Buyer | Sale Price | Title Company |
|---|---|---|---|
| Chivallati Gary A | $126,000 | -- | |
| Conlin Richard F | $106,000 | -- | |
| Peoples Heritage Bk | $81,611 | -- |
Source: Public Records
Mortgage History
| Date | Status | Borrower | Loan Amount |
|---|---|---|---|
| Open | Peoples Heritage Bk | $160,000 | |
| Closed | Peoples Heritage Bk | $122,250 |
Source: Public Records
Tax History
| Year | Tax Paid | Tax Assessment Tax Assessment Total Assessment is a certain percentage of the fair market value that is determined by local assessors to be the total taxable value of land and additions on the property. | Land | Improvement |
|---|---|---|---|---|
| 2025 | $5,407 | $465,300 | $326,000 | $139,300 |
| 2024 | $5,336 | $452,600 | $326,000 | $126,600 |
| 2023 | $5,364 | $426,400 | $283,100 | $143,300 |
| 2022 | $4,774 | $339,800 | $214,500 | $125,300 |
| 2021 | $4,950 | $337,900 | $238,300 | $99,600 |
| 2020 | $4,600 | $317,000 | $222,600 | $94,400 |
| 2019 | $4,531 | $309,100 | $214,700 | $94,400 |
| 2018 | $4,316 | $294,600 | $210,800 | $83,800 |
| 2017 | $4,094 | $280,800 | $197,000 | $83,800 |
| 2016 | $3,948 | $272,300 | $199,700 | $72,600 |
| 2015 | $3,965 | $267,200 | $194,600 | $72,600 |
| 2014 | $3,516 | $243,300 | $170,700 | $72,600 |
Source: Public Records
Map
Nearby Homes
- 29 Elm St
- 8 Woodhaven Dr
- 48 Dover Cir
- 839 Lincoln St
- 254 Daniels St
- 29 Hancock Rd
- 27 Dover Cir
- 24 Leanne Way Unit 24
- 83 Oliver Pond Cir Unit 7
- 91 Oliver Pond Cir Unit 3
- 72 Skyline Dr
- 253 Village St
- 14 Sanford St Unit 47
- 100 Daniels St
- 20 Broad St Unit 1
- 20 Broad St Unit 6
- 20 Broad St Unit A
- 20 Broad St Unit 4
- 10 Barber St
- 41 Kimberlee Ave
- 20 Partridge St
- 32 Partridge St
- 35 Elm St
- 16 Partridge St
- 40 Partridge St
- 36 Elm St
- 31 Elm St
- 33 Elm St
- 42 Partridge St
- 0 Lot 38 Elm St Unit 50489994
- 38 Elm St
- 15 Partridge St
- 3 Harborwood Dr
- 35 Partridge St
- 5 Harborwood Dr
- 43 Partridge St
- 39 Elm St
- 46 Partridge St
- 40 Elm St
- Lot 1 Kensington Estates
Your Personal Tour Guide
Ask me questions while you tour the home.