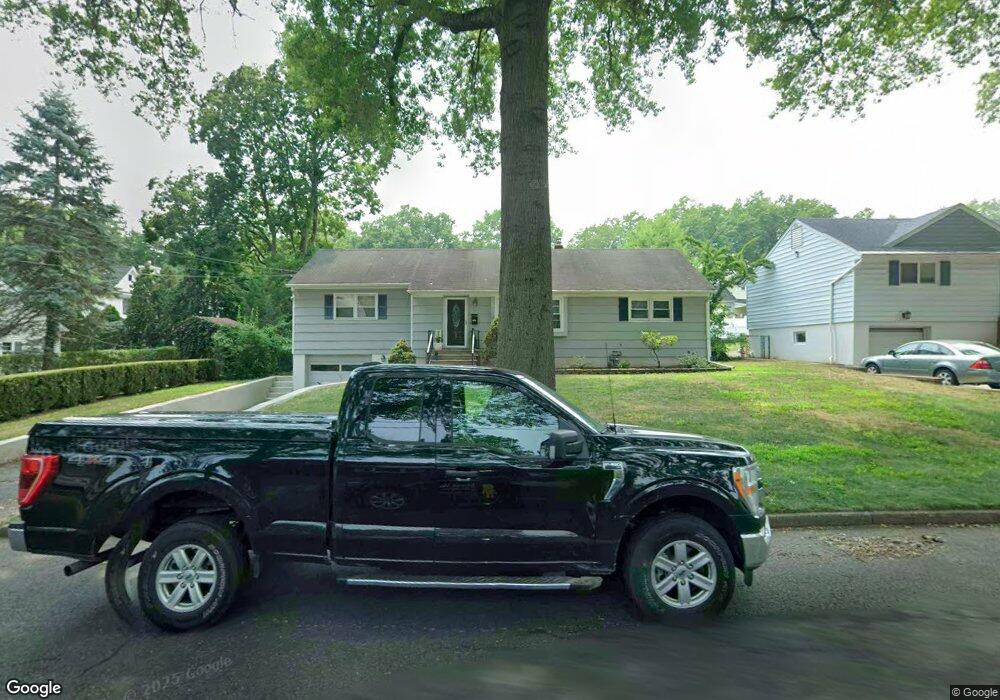
32 Engle Rd Paramus, NJ 07652
Estimated Value: $776,004 - $935,000
Studio
--
Bath
1,446
Sq Ft
$590/Sq Ft
Est. Value
About This Home
This home is located at 32 Engle Rd, Paramus, NJ 07652 and is currently estimated at $853,251, approximately $590 per square foot. 32 Engle Rd is a home located in Bergen County with nearby schools including Paramus High School and David Gregory School.
Ownership History
Date
Name
Owned For
Owner Type
Purchase Details
Closed on
Aug 1, 1996
Sold by
Riordan Thomas P
Bought by
Peters Riordan Thomas P and Peters Riordan Marianne
Current Estimated Value
Purchase Details
Closed on
Jul 25, 1995
Sold by
Peters Joe and Peters Michael
Bought by
Peters Marianne
Home Financials for this Owner
Home Financials are based on the most recent Mortgage that was taken out on this home.
Original Mortgage
$115,000
Interest Rate
7.48%
Create a Home Valuation Report for This Property
The Home Valuation Report is an in-depth analysis detailing your home's value as well as a comparison with similar homes in the area
Home Values in the Area
Average Home Value in this Area
Purchase History
| Date | Buyer | Sale Price | Title Company |
|---|---|---|---|
| Peters Riordan Thomas P | -- | -- | |
| Peters Marianne | $115,000 | -- |
Source: Public Records
Mortgage History
| Date | Status | Borrower | Loan Amount |
|---|---|---|---|
| Closed | Peters Marianne | $115,000 |
Source: Public Records
Tax History
| Year | Tax Paid | Tax Assessment Tax Assessment Total Assessment is a certain percentage of the fair market value that is determined by local assessors to be the total taxable value of land and additions on the property. | Land | Improvement |
|---|---|---|---|---|
| 2025 | $8,830 | $654,200 | $432,000 | $222,200 |
| 2024 | $8,552 | $583,200 | $372,700 | $210,500 |
| 2023 | $8,117 | $557,500 | $355,500 | $202,000 |
| 2022 | $8,117 | $523,000 | $332,300 | $190,700 |
| 2021 | $7,921 | $478,900 | $303,000 | $175,900 |
| 2020 | $7,449 | $467,000 | $293,000 | $174,000 |
| 2019 | $7,300 | $393,300 | $275,000 | $118,300 |
| 2018 | $7,209 | $393,300 | $275,000 | $118,300 |
| 2017 | $7,083 | $393,300 | $275,000 | $118,300 |
| 2016 | $6,891 | $393,300 | $275,000 | $118,300 |
| 2015 | $6,820 | $393,300 | $275,000 | $118,300 |
| 2014 | $6,761 | $393,300 | $275,000 | $118,300 |
Source: Public Records
Map
Nearby Homes
- 84 W Midland Ave
- 11 Gabriel Ct
- 14 Gabriel Ct
- 19 Gabriel Ct
- 24 Gabriel Ct
- 16 Gabriel Ct
- 496 Cedar Ln
- 461 Arthur Terrace
- 375 Burnet Place
- 360 Valley View Ave
- 298 Buttonwood Dr
- 105 Circle Dr
- 218 Mayfair Rd
- 232 W Midland Ave
- 311 N Farview Ave
- 495 Paramus Rd
- 206 Harwood Place
- 645 Cambridge Rd
- 216 E Midland Ave
- 495 Wilson Ave
Your Personal Tour Guide
Ask me questions while you tour the home.