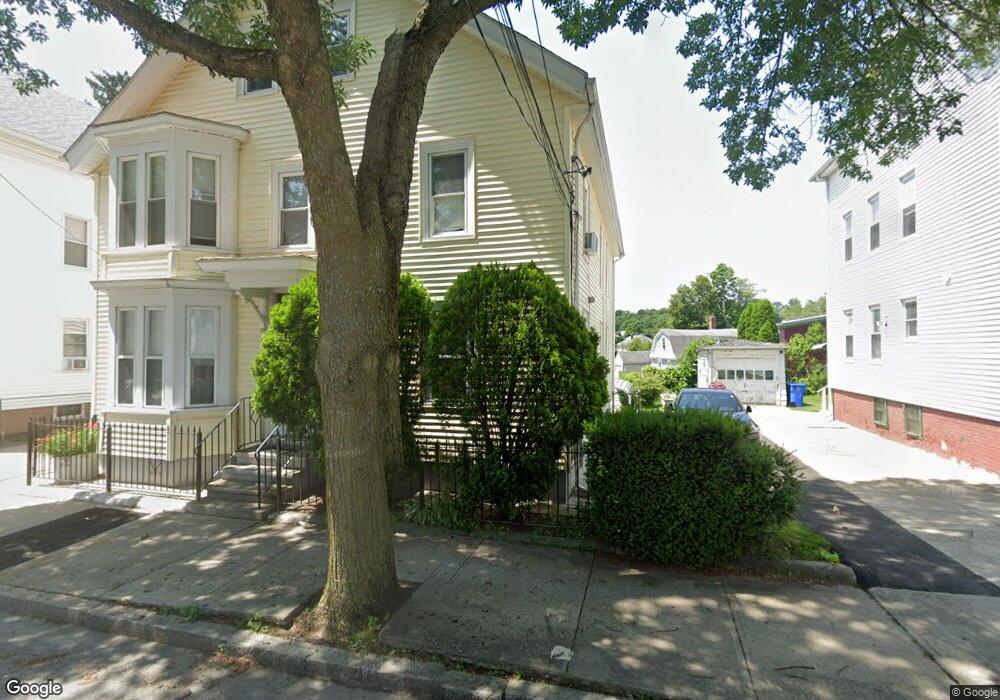
32 Grant Ave Cranston, RI 02920
Arlington NeighborhoodEstimated Value: $467,019 - $575,000
6
Beds
2
Baths
2,322
Sq Ft
$229/Sq Ft
Est. Value
About This Home
This home is located at 32 Grant Ave, Cranston, RI 02920 and is currently estimated at $531,255, approximately $228 per square foot. 32 Grant Ave is a home located in Providence County with nearby schools including Hugh B. Bain Middle School, Cranston High School East, and Achievement First Iluminar Mayoral Academy.
Ownership History
Date
Name
Owned For
Owner Type
Purchase Details
Closed on
Mar 6, 2024
Sold by
Santos Benedicto
Bought by
Soria Elsa B and Reyes Cindy S
Current Estimated Value
Purchase Details
Closed on
Aug 20, 1990
Sold by
Demers William A
Bought by
Santos Benedicto
Create a Home Valuation Report for This Property
The Home Valuation Report is an in-depth analysis detailing your home's value as well as a comparison with similar homes in the area
Home Values in the Area
Average Home Value in this Area
Purchase History
| Date | Buyer | Sale Price | Title Company |
|---|---|---|---|
| Soria Elsa B | -- | None Available | |
| Santos Benedicto | $117,000 | -- | |
| Santos Benedicto | $117,000 | -- |
Source: Public Records
Mortgage History
| Date | Status | Borrower | Loan Amount |
|---|---|---|---|
| Previous Owner | Santos Benedicto | $100,000 | |
| Previous Owner | Santos Benedicto | $93,000 | |
| Previous Owner | Santos Benedicto | $84,600 |
Source: Public Records
Tax History
| Year | Tax Paid | Tax Assessment Tax Assessment Total Assessment is a certain percentage of the fair market value that is determined by local assessors to be the total taxable value of land and additions on the property. | Land | Improvement |
|---|---|---|---|---|
| 2025 | $5,749 | $414,200 | $106,900 | $307,300 |
| 2024 | $5,637 | $414,200 | $106,900 | $307,300 |
| 2023 | $4,974 | $263,200 | $46,900 | $216,300 |
| 2022 | $4,872 | $263,200 | $46,900 | $216,300 |
| 2021 | $4,738 | $263,200 | $46,900 | $216,300 |
| 2020 | $4,285 | $206,300 | $36,900 | $169,400 |
| 2019 | $4,285 | $206,300 | $36,900 | $169,400 |
| 2018 | $4,186 | $206,300 | $36,900 | $169,400 |
| 2017 | $3,430 | $149,500 | $16,800 | $132,700 |
| 2016 | $3,356 | $149,500 | $16,800 | $132,700 |
| 2015 | $3,356 | $149,500 | $16,800 | $132,700 |
| 2014 | $3,159 | $138,300 | $16,800 | $121,500 |
Source: Public Records
Map
Nearby Homes
Your Personal Tour Guide
Ask me questions while you tour the home.