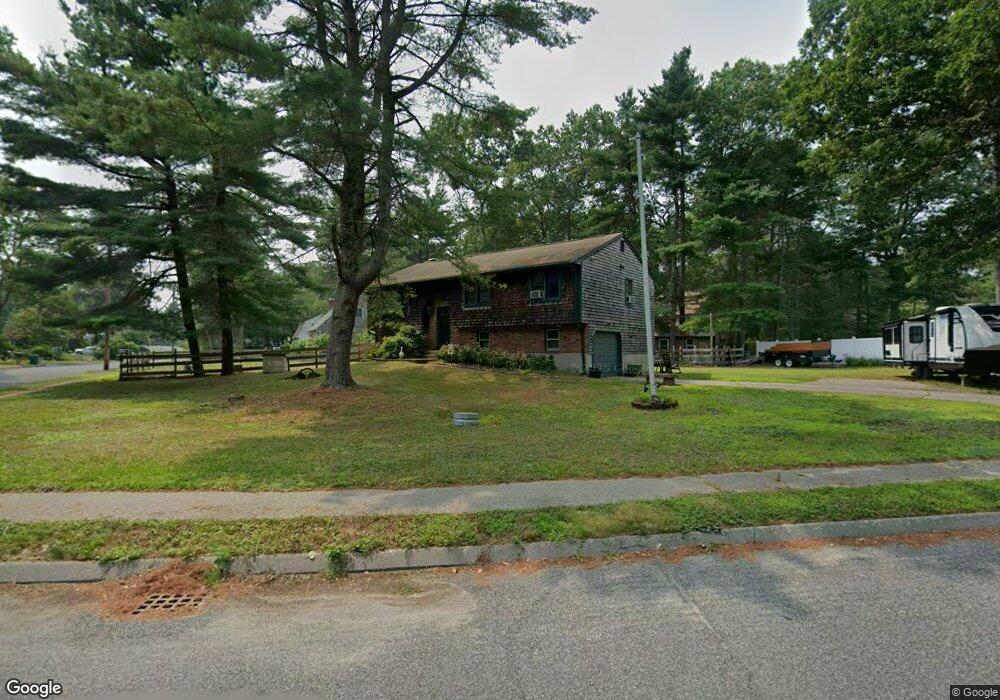
32 Lantern Ln Mansfield, MA 02048
Estimated Value: $583,005 - $801,000
3
Beds
1
Bath
1,180
Sq Ft
$564/Sq Ft
Est. Value
About This Home
This home is located at 32 Lantern Ln, Mansfield, MA 02048 and is currently estimated at $665,001, approximately $563 per square foot. 32 Lantern Ln is a home located in Bristol County with nearby schools including Everett W. Robinson Elementary School, Jordan/Jackson Elementary School, and Harold L. Qualters Middle School.
Ownership History
Date
Name
Owned For
Owner Type
Purchase Details
Closed on
Feb 29, 1996
Sold by
White Andrew P and White Ellen M
Bought by
Dietzel Jeffrey W and Dietzel Denise A
Current Estimated Value
Home Financials for this Owner
Home Financials are based on the most recent Mortgage that was taken out on this home.
Original Mortgage
$156,275
Outstanding Balance
$6,125
Interest Rate
7.02%
Mortgage Type
Purchase Money Mortgage
Estimated Equity
$658,876
Create a Home Valuation Report for This Property
The Home Valuation Report is an in-depth analysis detailing your home's value as well as a comparison with similar homes in the area
Home Values in the Area
Average Home Value in this Area
Purchase History
| Date | Buyer | Sale Price | Title Company |
|---|---|---|---|
| Dietzel Jeffrey W | $164,500 | -- |
Source: Public Records
Mortgage History
| Date | Status | Borrower | Loan Amount |
|---|---|---|---|
| Open | Dietzel Jeffrey W | $156,275 |
Source: Public Records
Tax History
| Year | Tax Paid | Tax Assessment Tax Assessment Total Assessment is a certain percentage of the fair market value that is determined by local assessors to be the total taxable value of land and additions on the property. | Land | Improvement |
|---|---|---|---|---|
| 2025 | $6,863 | $521,100 | $267,200 | $253,900 |
| 2024 | $6,695 | $495,900 | $278,800 | $217,100 |
| 2023 | $6,603 | $468,600 | $278,800 | $189,800 |
| 2022 | $6,415 | $422,900 | $258,100 | $164,800 |
| 2021 | $2,271 | $380,300 | $215,100 | $165,200 |
| 2020 | $5,907 | $384,600 | $215,100 | $169,500 |
| 2019 | $2,008 | $348,700 | $179,200 | $169,500 |
| 2018 | $5,200 | $327,400 | $170,800 | $156,600 |
| 2017 | $5,058 | $325,200 | $165,700 | $159,500 |
| 2016 | $4,823 | $313,000 | $157,800 | $155,200 |
| 2015 | $4,518 | $291,500 | $157,800 | $133,700 |
Source: Public Records
Map
Nearby Homes
- 2 Oak St Unit 2B
- 14 Claire Ave
- 451R Gilbert St
- 250 Mansfield Ave Unit 11
- 150 Gilbert St
- 343 Godfrey Dr
- 143 Oak St Unit 10
- 71 Richardson Ave
- 157 Mansfield Ave Unit 27
- 157 Mansfield Ave Unit 14
- 10 Walter St
- 128 Tremont St
- 49 Pheasant Hill Rd
- 19 Barberry Rd
- 16 Holly Rd
- 20 John F. Kennedy Dr
- 4 Village Way Unit F
- 345 Richardson Ave
- 21 Juniper Rd
- 24 Maverick Dr
Your Personal Tour Guide
Ask me questions while you tour the home.