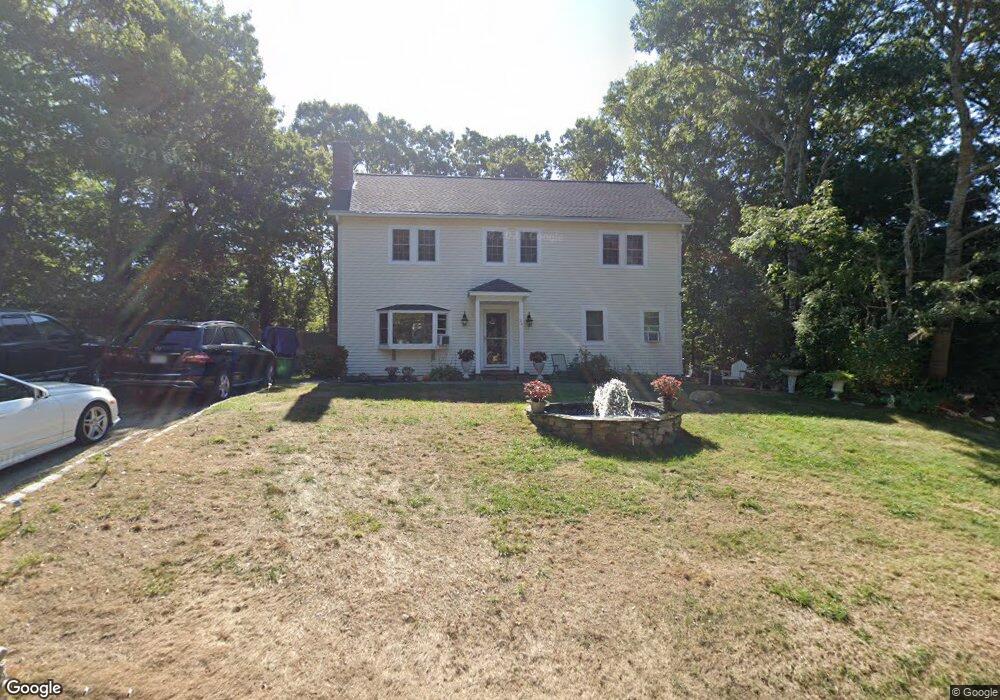
32 Leamington Ln Mashpee, MA 02649
Estimated Value: $574,000 - $801,000
2
Beds
2
Baths
1,201
Sq Ft
$565/Sq Ft
Est. Value
About This Home
This home is located at 32 Leamington Ln, Mashpee, MA 02649 and is currently estimated at $678,884, approximately $565 per square foot. 32 Leamington Ln is a home located in Barnstable County with nearby schools including Kenneth C. Coombs School, Quashnet School, and Mashpee Middle School.
Ownership History
Date
Name
Owned For
Owner Type
Purchase Details
Closed on
Dec 13, 2021
Sold by
Graham Marlon M and Graham Edwina J
Bought by
Graham Marlon M and Graham Edwina J
Current Estimated Value
Home Financials for this Owner
Home Financials are based on the most recent Mortgage that was taken out on this home.
Original Mortgage
$289,987
Outstanding Balance
$265,126
Interest Rate
2.98%
Mortgage Type
FHA
Estimated Equity
$413,758
Purchase Details
Closed on
Dec 31, 1999
Sold by
Seaman Douglas A and Seaman Kathy M
Bought by
Johnson Edwina J and Graham Marlon M
Home Financials for this Owner
Home Financials are based on the most recent Mortgage that was taken out on this home.
Original Mortgage
$124,564
Interest Rate
7.71%
Mortgage Type
Purchase Money Mortgage
Create a Home Valuation Report for This Property
The Home Valuation Report is an in-depth analysis detailing your home's value as well as a comparison with similar homes in the area
Purchase History
| Date | Buyer | Sale Price | Title Company |
|---|---|---|---|
| Graham Marlon M | -- | None Available | |
| Graham Marlon M | -- | None Available | |
| Johnson Edwina J | $125,000 | -- | |
| Johnson Edwina J | $125,000 | -- |
Source: Public Records
Mortgage History
| Date | Status | Borrower | Loan Amount |
|---|---|---|---|
| Open | Graham Marlon M | $289,987 | |
| Closed | Graham Marlon M | $289,987 | |
| Previous Owner | Johnson Edwina J | $213,750 | |
| Previous Owner | Johnson Edwina J | $177,314 | |
| Previous Owner | Johnson Edwina J | $124,564 |
Source: Public Records
Tax History
| Year | Tax Paid | Tax Assessment Tax Assessment Total Assessment is a certain percentage of the fair market value that is determined by local assessors to be the total taxable value of land and additions on the property. | Land | Improvement |
|---|---|---|---|---|
| 2025 | $3,934 | $594,200 | $186,300 | $407,900 |
| 2024 | $3,616 | $562,400 | $169,400 | $393,000 |
| 2023 | $2,390 | $340,900 | $161,300 | $179,600 |
| 2022 | $2,270 | $277,800 | $131,200 | $146,600 |
| 2021 | $2,166 | $238,800 | $118,100 | $120,700 |
| 2020 | $2,103 | $231,300 | $113,600 | $117,700 |
| 2019 | $2,015 | $222,700 | $113,600 | $109,100 |
| 2018 | $1,847 | $207,100 | $113,600 | $93,500 |
| 2017 | $1,822 | $198,300 | $113,600 | $84,700 |
| 2016 | $1,776 | $192,200 | $113,600 | $78,600 |
| 2015 | $1,713 | $188,000 | $113,600 | $74,400 |
| 2014 | $1,733 | $184,600 | $112,200 | $72,400 |
Source: Public Records
Map
Nearby Homes
- 544 Cotuit Rd
- 10 Candlewood Ln
- 45 Fox Hill Rd
- 20 Lakewood Dr
- 63 Deer Ridge Rd
- 24 Widow Coombs Walk
- 45 Pequot Rd
- 290 Main St
- 235 Main St
- 36 Moon Compass Ln
- 173 Main St
- 19 Oriole Ln
- 111 Reflection Dr
- 48 Holly Ridge Dr
- 52 Old Colony Dr
- 35 Claulise Ln
- 9 Viking Ln
- 35 Ashumet Rd Unit 14A
- 35 Ashumet Rd Unit 5B
- 35 Ashumet Rd Unit 9A
- 26 Leamington Ln
- 38 Leamington Ln
- 124 Scituate Rd
- 118 Scituate Rd
- 31 Leamington Ln
- 128 Scituate Rd
- 25 Leamington Ln
- 20 Leamington Ln
- 35 Leamington Ln
- 44 Leamington Ln
- 114 Scituate Rd
- 21 Leamington Ln
- 132 Scituate Rd
- 14 Leamington Ln
- 38 Warwick Way
- 39 Warwick Way
- 2 Cambridge Dr
- 110 Scituate Rd
- 125 Scituate Rd
- 138 Scituate Rd
Your Personal Tour Guide
Ask me questions while you tour the home.