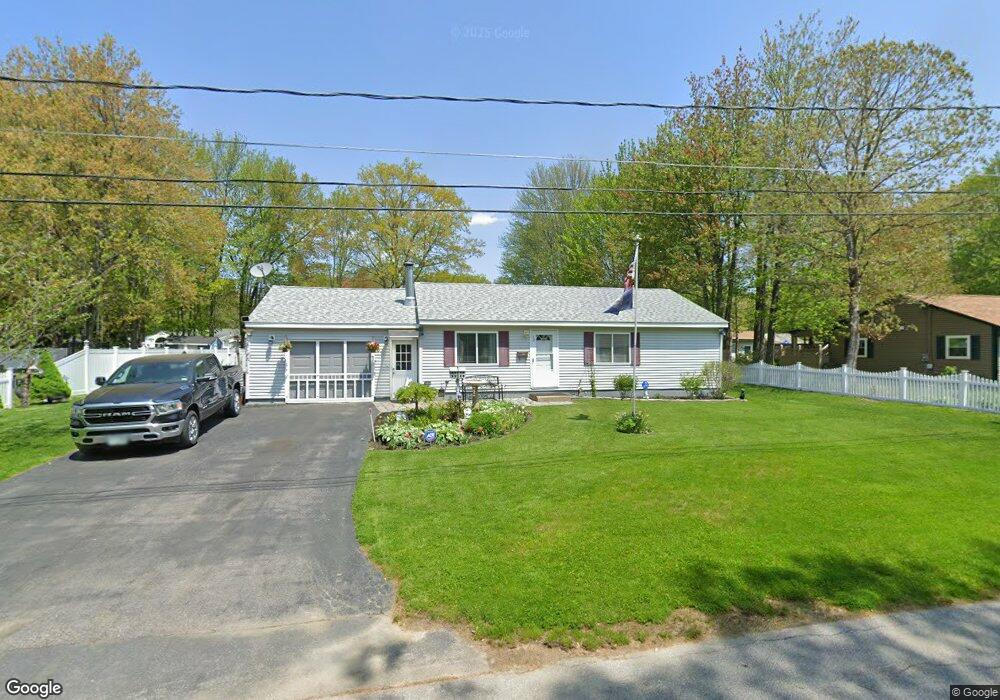
32 Nutter St Rochester, NH 03867
Estimated Value: $365,279 - $382,000
3
Beds
1
Bath
988
Sq Ft
$379/Sq Ft
Est. Value
About This Home
This home is located at 32 Nutter St, Rochester, NH 03867 and is currently estimated at $374,320, approximately $378 per square foot. 32 Nutter St is a home located in Strafford County with nearby schools including Chamberlain Street School, Rochester Middle School, and Spaulding High School.
Ownership History
Date
Name
Owned For
Owner Type
Purchase Details
Closed on
Nov 1, 2012
Sold by
Reid Mary Ann and Reid John P
Bought by
Simpson Judith W
Current Estimated Value
Purchase Details
Closed on
Jun 30, 2008
Sold by
Sandy Brook Corp
Bought by
Reid John Phillip
Home Financials for this Owner
Home Financials are based on the most recent Mortgage that was taken out on this home.
Original Mortgage
$215,000
Interest Rate
6.07%
Mortgage Type
Purchase Money Mortgage
Purchase Details
Closed on
Jun 19, 2007
Sold by
Hersey Donald M and Hersey Edith M
Bought by
Desrochers Maurice W
Home Financials for this Owner
Home Financials are based on the most recent Mortgage that was taken out on this home.
Original Mortgage
$187,000
Interest Rate
6.19%
Mortgage Type
Purchase Money Mortgage
Create a Home Valuation Report for This Property
The Home Valuation Report is an in-depth analysis detailing your home's value as well as a comparison with similar homes in the area
Home Values in the Area
Average Home Value in this Area
Purchase History
| Date | Buyer | Sale Price | Title Company |
|---|---|---|---|
| Simpson Judith W | $210,000 | -- | |
| Reid John Phillip | $315,000 | -- | |
| Desrochers Maurice W | $187,000 | -- |
Source: Public Records
Mortgage History
| Date | Status | Borrower | Loan Amount |
|---|---|---|---|
| Previous Owner | Desrochers Maurice W | $215,000 | |
| Previous Owner | Desrochers Maurice W | $187,000 |
Source: Public Records
Tax History Compared to Growth
Tax History
| Year | Tax Paid | Tax Assessment Tax Assessment Total Assessment is a certain percentage of the fair market value that is determined by local assessors to be the total taxable value of land and additions on the property. | Land | Improvement |
|---|---|---|---|---|
| 2024 | $4,617 | $310,900 | $82,500 | $228,400 |
| 2023 | $3,884 | $150,900 | $53,900 | $97,000 |
| 2022 | $3,815 | $150,900 | $53,900 | $97,000 |
| 2021 | $3,720 | $150,900 | $53,900 | $97,000 |
| 2020 | $3,711 | $150,800 | $53,900 | $96,900 |
| 2019 | $3,755 | $150,800 | $53,900 | $96,900 |
| 2018 | $3,952 | $143,600 | $40,400 | $103,200 |
| 2017 | $3,781 | $143,600 | $40,400 | $103,200 |
| 2016 | $3,535 | $125,100 | $40,400 | $84,700 |
| 2015 | $3,522 | $125,100 | $40,400 | $84,700 |
| 2014 | $3,412 | $124,200 | $40,400 | $83,800 |
| 2013 | $3,424 | $129,900 | $53,900 | $76,000 |
| 2012 | $3,336 | $129,900 | $53,900 | $76,000 |
Source: Public Records
Map
Nearby Homes
- 22 Corson St
- 56 Chamberlain St
- 0 Franklin St Unit 55 4959653
- 35 Franklin Heights
- 32 Adams Ave
- 38 Western Ave
- 518 & 532 Portland St
- 67 Winter St
- 10 Sarah Ct
- 68 Moose Ln
- 10 Lady Slipper Ct
- 1 Farrington St
- 17 Winter St
- 47 Hanson St
- 45 Hanson St
- 616 Portland St Unit 75
- 15 Linden St
- 3 Dodge St
- 105 Wakefield St
- 86 Wakefield St