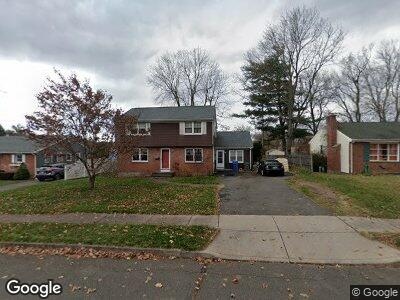
32 Philip Rd Manchester, CT 06040
East Side NeighborhoodEstimated Value: $312,000 - $332,000
3
Beds
2
Baths
1,588
Sq Ft
$204/Sq Ft
Est. Value
About This Home
This home is located at 32 Philip Rd, Manchester, CT 06040 and is currently estimated at $324,711, approximately $204 per square foot. 32 Philip Rd is a home located in Hartford County with nearby schools including Martin Elementary School, Elisabeth M. Bennet Academy, and Illing Middle School.
Ownership History
Date
Name
Owned For
Owner Type
Purchase Details
Closed on
Dec 14, 1999
Sold by
Thompson Paul and Thompson Lella F
Bought by
Anderson Scott D and Anderson Dawn M
Current Estimated Value
Home Financials for this Owner
Home Financials are based on the most recent Mortgage that was taken out on this home.
Original Mortgage
$127,835
Interest Rate
7.9%
Create a Home Valuation Report for This Property
The Home Valuation Report is an in-depth analysis detailing your home's value as well as a comparison with similar homes in the area
Home Values in the Area
Average Home Value in this Area
Purchase History
| Date | Buyer | Sale Price | Title Company |
|---|---|---|---|
| Anderson Scott D | $127,900 | -- | |
| Anderson Scott D | $127,900 | -- |
Source: Public Records
Mortgage History
| Date | Status | Borrower | Loan Amount |
|---|---|---|---|
| Open | Thompson Paul | $151,000 | |
| Closed | Thompson Paul | $129,580 | |
| Closed | Thompson Paul | $127,835 |
Source: Public Records
Tax History Compared to Growth
Tax History
| Year | Tax Paid | Tax Assessment Tax Assessment Total Assessment is a certain percentage of the fair market value that is determined by local assessors to be the total taxable value of land and additions on the property. | Land | Improvement |
|---|---|---|---|---|
| 2024 | $5,879 | $152,000 | $37,500 | $114,500 |
| 2023 | $5,654 | $152,000 | $37,500 | $114,500 |
| 2022 | $5,490 | $152,000 | $37,500 | $114,500 |
| 2021 | $4,788 | $114,200 | $32,200 | $82,000 |
| 2020 | $4,782 | $114,200 | $32,200 | $82,000 |
| 2019 | $4,762 | $114,200 | $32,200 | $82,000 |
| 2018 | $4,672 | $114,200 | $32,200 | $82,000 |
| 2017 | $4,539 | $114,200 | $32,200 | $82,000 |
| 2016 | $4,706 | $118,600 | $41,200 | $77,400 |
| 2015 | $4,673 | $118,600 | $41,200 | $77,400 |
| 2014 | $4,584 | $118,600 | $41,200 | $77,400 |
Source: Public Records
Map
Nearby Homes