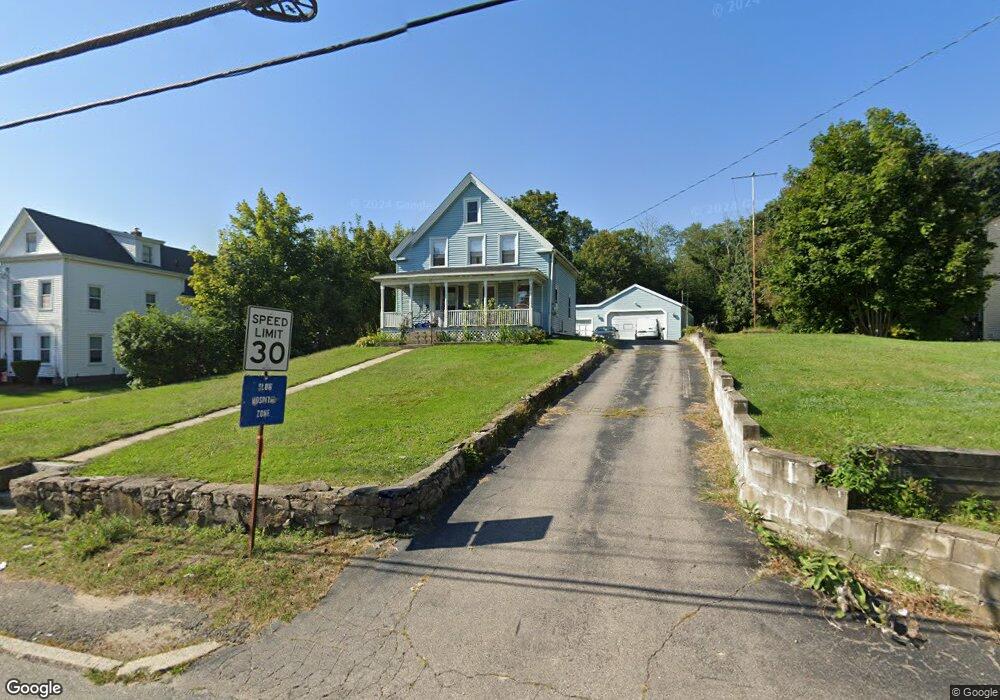
32 Prospect St Milford, MA 01757
Estimated Value: $457,000 - $490,518
3
Beds
1
Bath
1,444
Sq Ft
$331/Sq Ft
Est. Value
About This Home
This home is located at 32 Prospect St, Milford, MA 01757 and is currently estimated at $477,630, approximately $330 per square foot. 32 Prospect St is a home located in Worcester County with nearby schools including Milford High School and Mendon Mennonite School.
Ownership History
Date
Name
Owned For
Owner Type
Purchase Details
Closed on
Jul 30, 2024
Sold by
Lavigne Warren A and Lavigne Joyce A
Bought by
Lavigne Warren A and Lavigne Joyce A
Current Estimated Value
Purchase Details
Closed on
Aug 31, 1984
Bought by
Lavigne Warren A and Lavigne Joyce A
Create a Home Valuation Report for This Property
The Home Valuation Report is an in-depth analysis detailing your home's value as well as a comparison with similar homes in the area
Home Values in the Area
Average Home Value in this Area
Purchase History
| Date | Buyer | Sale Price | Title Company |
|---|---|---|---|
| Lavigne Warren A | -- | None Available | |
| Lavigne Warren A | -- | None Available | |
| Lavigne Warren A | $38,000 | -- |
Source: Public Records
Mortgage History
| Date | Status | Borrower | Loan Amount |
|---|---|---|---|
| Previous Owner | Lavigne Warren A | $50,000 | |
| Previous Owner | Lavigne Warren A | $59,250 | |
| Previous Owner | Lavigne Warren A | $50,000 |
Source: Public Records
Tax History Compared to Growth
Tax History
| Year | Tax Paid | Tax Assessment Tax Assessment Total Assessment is a certain percentage of the fair market value that is determined by local assessors to be the total taxable value of land and additions on the property. | Land | Improvement |
|---|---|---|---|---|
| 2025 | $5,317 | $415,400 | $169,000 | $246,400 |
| 2024 | $5,129 | $385,900 | $161,100 | $224,800 |
| 2023 | $5,205 | $360,200 | $147,300 | $212,900 |
| 2022 | $4,996 | $324,600 | $133,600 | $191,000 |
| 2021 | $5,467 | $292,100 | $133,600 | $158,500 |
| 2020 | $4,619 | $289,400 | $133,600 | $155,800 |
| 2019 | $5,265 | $259,500 | $133,600 | $125,900 |
| 2018 | $4,297 | $259,500 | $133,600 | $125,900 |
| 2017 | $4,130 | $246,000 | $133,600 | $112,400 |
| 2016 | $4,111 | $239,300 | $133,600 | $105,700 |
| 2015 | $4,101 | $233,700 | $127,700 | $106,000 |
Source: Public Records
Map
Nearby Homes