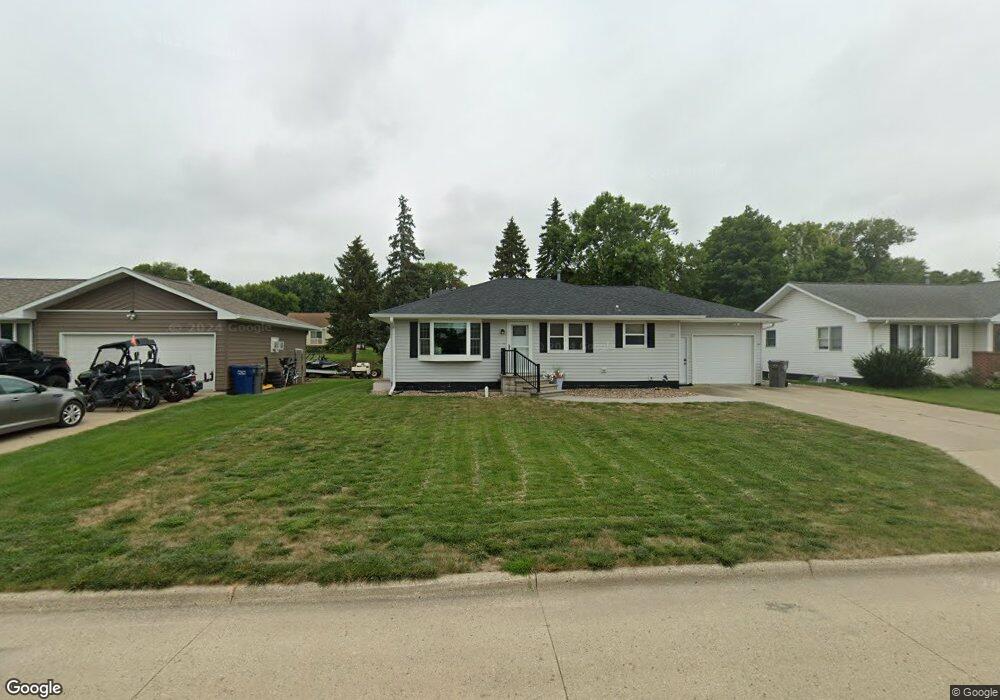
320 E 3rd St Remsen, IA 51050
Estimated Value: $184,000 - $219,102
3
Beds
3
Baths
1,140
Sq Ft
$179/Sq Ft
Est. Value
About This Home
This home is located at 320 E 3rd St, Remsen, IA 51050 and is currently estimated at $204,526, approximately $179 per square foot. 320 E 3rd St is a home located in Plymouth County with nearby schools including Remsen-Union Elementary School, St. Catherine-St. Mary's Grade School, and Great Beginnings Preschool.
Ownership History
Date
Name
Owned For
Owner Type
Purchase Details
Closed on
Mar 28, 2014
Sold by
Phelps Robert B and Phelps Carol E
Bought by
Phelps Carol E and The Carol E Phelps Revocable Trust
Current Estimated Value
Purchase Details
Closed on
Nov 15, 2013
Sold by
Castle William F and Castle Kathleen M
Bought by
Rensink Charles B and Rensink Kendra Kay
Home Financials for this Owner
Home Financials are based on the most recent Mortgage that was taken out on this home.
Original Mortgage
$138,000
Outstanding Balance
$102,640
Interest Rate
4.24%
Mortgage Type
New Conventional
Estimated Equity
$101,886
Create a Home Valuation Report for This Property
The Home Valuation Report is an in-depth analysis detailing your home's value as well as a comparison with similar homes in the area
Purchase History
| Date | Buyer | Sale Price | Title Company |
|---|---|---|---|
| Phelps Carol E | -- | None Available | |
| Phelps Robert B | -- | None Available | |
| Phelps Carol E | -- | None Available | |
| Rensink Charles B | $150,000 | None Available |
Source: Public Records
Mortgage History
| Date | Status | Borrower | Loan Amount |
|---|---|---|---|
| Open | Rensink Charles B | $138,000 |
Source: Public Records
Tax History
| Year | Tax Paid | Tax Assessment Tax Assessment Total Assessment is a certain percentage of the fair market value that is determined by local assessors to be the total taxable value of land and additions on the property. | Land | Improvement |
|---|---|---|---|---|
| 2025 | $2,386 | $204,080 | $21,120 | $182,960 |
| 2024 | $2,370 | $189,400 | $21,120 | $168,280 |
| 2023 | $2,208 | $190,460 | $16,240 | $174,220 |
| 2022 | $2,202 | $151,930 | $16,240 | $135,690 |
| 2021 | $2,078 | $151,930 | $16,240 | $135,690 |
| 2020 | $2,078 | $136,100 | $16,240 | $119,860 |
Source: Public Records
Map
Nearby Homes
- 418 Madison St
- 621 Harrison St
- 626 Harrison St
- 609 S Washington St
- 622 S Washington St
- 14338 Quest Ave
- 38581 120th St
- 300 N Maple St
- 101 W Amherst St
- 109 N Locust St
- 308 S Elm St
- 405 N Elm St
- 303 N Ash St
- 308 N Beech St
- 305 N Ames St
- 1550 Willow Run Blvd
- 34645 180th St
- 1335 2nd St SE
- 1201 2nd St SE
- 21 Park Village
Your Personal Tour Guide
Ask me questions while you tour the home.