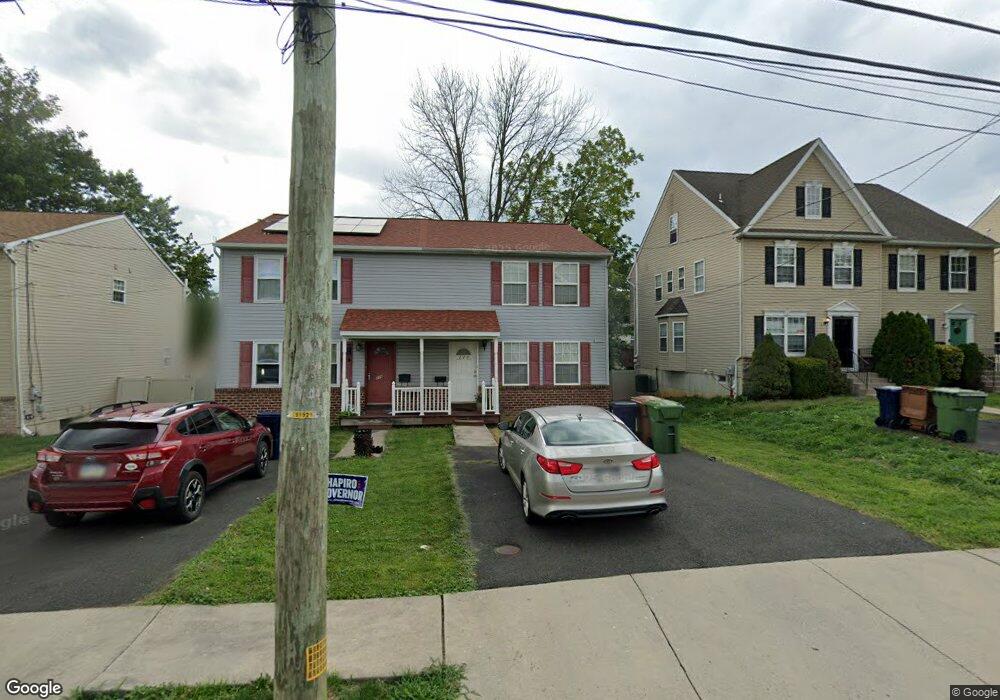
320 Logan Ave Glenside, PA 19038
Estimated Value: $353,000 - $409,000
3
Beds
2
Baths
1,512
Sq Ft
$253/Sq Ft
Est. Value
About This Home
This home is located at 320 Logan Ave, Glenside, PA 19038 and is currently estimated at $383,007, approximately $253 per square foot. 320 Logan Ave is a home located in Montgomery County with nearby schools including Thomas Fitzwater Elementary School, Sandy Run Middle School, and Upper Dublin High School.
Ownership History
Date
Name
Owned For
Owner Type
Purchase Details
Closed on
Oct 2, 2025
Sold by
Neal Pamela and Neal Vaughn R
Bought by
Neal Vaughn R and Neal Sophia
Current Estimated Value
Purchase Details
Closed on
Jan 20, 2005
Sold by
Not Provided
Bought by
Not Provided
Purchase Details
Closed on
Dec 31, 2004
Sold by
Leeland Bldrs Inc and Leeland Thomas C
Bought by
Neal Russell E and Neal Pamela
Purchase Details
Closed on
Dec 29, 2004
Sold by
Not Provided
Bought by
Not Provided
Purchase Details
Closed on
Feb 27, 2003
Sold by
Colleen Grasty
Bought by
Leeland Builders Inc
Create a Home Valuation Report for This Property
The Home Valuation Report is an in-depth analysis detailing your home's value as well as a comparison with similar homes in the area
Home Values in the Area
Average Home Value in this Area
Purchase History
| Date | Buyer | Sale Price | Title Company |
|---|---|---|---|
| Neal Vaughn R | -- | None Listed On Document | |
| Not Provided | $189,035 | -- | |
| Neal Russell E | $184,900 | -- | |
| Not Provided | $189,035 | -- | |
| Leeland Builders Inc | $16,800 | -- | |
| Leeland Bldrs Inc | $16,800 | -- | |
| Leeland Builders Inc | $16,800 | -- |
Source: Public Records
Mortgage History
| Date | Status | Borrower | Loan Amount |
|---|---|---|---|
| Closed | Not Provided | $0 |
Source: Public Records
Tax History
| Year | Tax Paid | Tax Assessment Tax Assessment Total Assessment is a certain percentage of the fair market value that is determined by local assessors to be the total taxable value of land and additions on the property. | Land | Improvement |
|---|---|---|---|---|
| 2025 | $5,958 | $122,170 | $37,270 | $84,900 |
| 2024 | $5,958 | $122,170 | $37,270 | $84,900 |
| 2023 | $5,819 | $122,170 | $37,270 | $84,900 |
| 2022 | $5,692 | $122,170 | $37,270 | $84,900 |
| 2021 | $5,550 | $122,170 | $37,270 | $84,900 |
| 2020 | $5,390 | $122,170 | $37,270 | $84,900 |
| 2019 | $5,299 | $122,170 | $37,270 | $84,900 |
| 2018 | $5,300 | $122,170 | $37,270 | $84,900 |
| 2017 | $5,106 | $122,170 | $37,270 | $84,900 |
| 2016 | $5,059 | $122,170 | $37,270 | $84,900 |
| 2015 | $4,935 | $122,170 | $37,270 | $84,900 |
| 2014 | $4,778 | $122,170 | $37,270 | $84,900 |
Source: Public Records
Map
Nearby Homes
- 250 Logan Ave
- 257 Girard Ave
- 3009 Limekiln Pike
- 616 Tennis Ave
- 57 Chelfield Rd
- 461 Hamel Ave
- 717 Garfield Ave
- 2718 Hawthorne Rd
- 624 Hamel Ave
- 762 Garfield Ave
- 747 Tennis Ave
- 152 Egerton Ave
- 630 Jackson Ave
- 302 Garth Rd
- 404 Enfield Rd
- 906 Garfield Ave
- 910 Garfield Ave
- 513 Waln Rd
- 65 Limekiln Pike
- 445 Tyson Ave
Your Personal Tour Guide
Ask me questions while you tour the home.