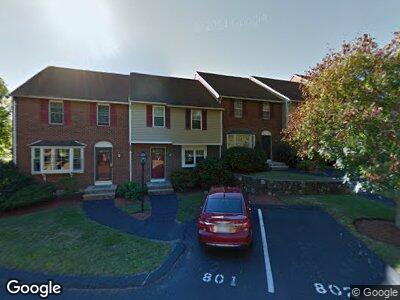
320 Newbury St Unit 203 Danvers, MA 01923
Estimated Value: $524,000 - $547,000
2
Beds
3
Baths
1,217
Sq Ft
$440/Sq Ft
Est. Value
About This Home
This home is located at 320 Newbury St Unit 203, Danvers, MA 01923 and is currently estimated at $536,060, approximately $440 per square foot. 320 Newbury St Unit 203 is a home located in Essex County with nearby schools including Danvers High School, St. Mary of the Annunciation School, and St. John's Prep.
Ownership History
Date
Name
Owned For
Owner Type
Purchase Details
Closed on
Apr 30, 2008
Sold by
Lynch James E and Mccormick Jane E
Bought by
Shockley David P
Current Estimated Value
Home Financials for this Owner
Home Financials are based on the most recent Mortgage that was taken out on this home.
Original Mortgage
$290,700
Interest Rate
5.99%
Mortgage Type
Purchase Money Mortgage
Purchase Details
Closed on
Aug 15, 2005
Sold by
Mccormick Jane E
Bought by
Lynch James E and Mccormick Jane E
Home Financials for this Owner
Home Financials are based on the most recent Mortgage that was taken out on this home.
Original Mortgage
$218,000
Interest Rate
5.54%
Purchase Details
Closed on
Mar 28, 1997
Sold by
Denaro Frank M
Bought by
Mccormick John W
Home Financials for this Owner
Home Financials are based on the most recent Mortgage that was taken out on this home.
Original Mortgage
$114,400
Interest Rate
7.59%
Mortgage Type
Purchase Money Mortgage
Create a Home Valuation Report for This Property
The Home Valuation Report is an in-depth analysis detailing your home's value as well as a comparison with similar homes in the area
Home Values in the Area
Average Home Value in this Area
Purchase History
| Date | Buyer | Sale Price | Title Company |
|---|---|---|---|
| Shockley David P | $306,000 | -- | |
| Shockley David P | $306,000 | -- | |
| Lynch James E | -- | -- | |
| Mccormick John W | $143,000 | -- |
Source: Public Records
Mortgage History
| Date | Status | Borrower | Loan Amount |
|---|---|---|---|
| Open | Bovest Dianne E | $224,000 | |
| Closed | Bovest Dianne E | $227,000 | |
| Closed | Mansfield Michelle L | $209,500 | |
| Closed | Mansfield Michelle L | $210,000 | |
| Closed | Shockley David P | $290,700 | |
| Previous Owner | Lynch James E | $218,000 | |
| Previous Owner | Mccormick John W | $114,400 | |
| Closed | Mccormick John W | $14,300 |
Source: Public Records
Tax History Compared to Growth
Tax History
| Year | Tax Paid | Tax Assessment Tax Assessment Total Assessment is a certain percentage of the fair market value that is determined by local assessors to be the total taxable value of land and additions on the property. | Land | Improvement |
|---|---|---|---|---|
| 2025 | $4,940 | $449,500 | $0 | $449,500 |
| 2024 | $4,738 | $426,500 | $0 | $426,500 |
| 2023 | $4,444 | $378,200 | $0 | $378,200 |
| 2022 | $4,574 | $361,300 | $0 | $361,300 |
| 2021 | $4,893 | $366,500 | $0 | $366,500 |
| 2020 | $4,922 | $376,900 | $0 | $376,900 |
| 2019 | $4,420 | $332,800 | $0 | $332,800 |
| 2018 | $4,956 | $366,000 | $0 | $366,000 |
| 2017 | $5,018 | $353,600 | $0 | $353,600 |
| 2016 | $5,021 | $353,600 | $0 | $353,600 |
| 2015 | $4,644 | $311,500 | $0 | $311,500 |
Source: Public Records
Map
Nearby Homes
- 320 Newbury St Unit 806
- 518 Maple St
- 100 Kirkbride Dr Unit 229
- 100 Kirkbride Dr Unit 227
- 200 North St Unit 11-B
- 200 North St
- 200 North St Unit 7C
- 3 Saratoga Ln
- 40 Village Rd Unit PH4
- 807 Ferncroft Tower Unit 807
- 11 Strawberry Hill Ln
- 38 Village Rd Unit 601
- 38 Village Rd Unit 309
- 36 Village Rd Unit 108
- 38 Reservoir Dr
- 2 Thomas Rd
- 4 Innis Dr
- 4 Chatham Ln
- 11 Alma Ln
- 10 Grace Rd
- 320 Newbury St Unit 403
- 320 Newbury St Unit 1002
- 320 Newbury St Unit 802
- 320 Newbury St Unit 302
- 320 Newbury St Unit 103
- 320 Newbury St Unit 507
- 320 Newbury St Unit 706
- 320 Newbury St Unit 1105
- 320 Newbury St Unit 306
- 320 Newbury St Unit 904
- 320 Newbury St Unit 203
- 320 Newbury St Unit 1102
- 320 Newbury St Unit 902
- 320 Newbury St Unit 401,4
- 320 Newbury St Unit 1101
- 320 Newbury St Unit 201
- 320 Newbury St Unit 903
- 320 Newbury St Unit 702
- 320 Newbury St Unit 701
- 320 Newbury St Unit 402