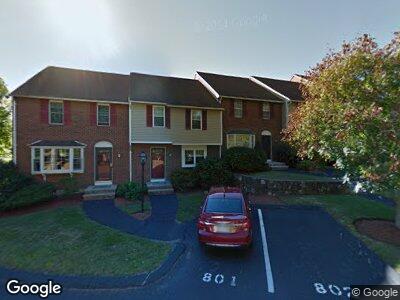
320 Newbury St Unit 403 Danvers, MA 01923
Estimated Value: $498,000 - $527,000
2
Beds
2
Baths
1,218
Sq Ft
$422/Sq Ft
Est. Value
About This Home
This home is located at 320 Newbury St Unit 403, Danvers, MA 01923 and is currently estimated at $513,566, approximately $421 per square foot. 320 Newbury St Unit 403 is a home located in Essex County with nearby schools including Danvers High School, St. Mary of the Annunciation School, and St. John's Prep.
Ownership History
Date
Name
Owned For
Owner Type
Purchase Details
Closed on
Jul 31, 2008
Sold by
Hogan Kristine E and Hogan Shawn F
Bought by
Andrews Ryan P
Current Estimated Value
Home Financials for this Owner
Home Financials are based on the most recent Mortgage that was taken out on this home.
Original Mortgage
$240,750
Interest Rate
6.47%
Mortgage Type
Purchase Money Mortgage
Purchase Details
Closed on
May 29, 2003
Sold by
Hamson Jenna S and Jones Jenna S
Bought by
Hogan Kristine E and Hogan Shawn F
Home Financials for this Owner
Home Financials are based on the most recent Mortgage that was taken out on this home.
Original Mortgage
$253,000
Interest Rate
5.86%
Mortgage Type
Purchase Money Mortgage
Purchase Details
Closed on
Nov 4, 1993
Sold by
Vmj Rt and Bento Diane J
Bought by
Hamson Jenna S
Home Financials for this Owner
Home Financials are based on the most recent Mortgage that was taken out on this home.
Original Mortgage
$98,000
Interest Rate
6.83%
Mortgage Type
Purchase Money Mortgage
Create a Home Valuation Report for This Property
The Home Valuation Report is an in-depth analysis detailing your home's value as well as a comparison with similar homes in the area
Home Values in the Area
Average Home Value in this Area
Purchase History
| Date | Buyer | Sale Price | Title Company |
|---|---|---|---|
| Andrews Ryan P | $267,500 | -- | |
| Andrews Ryan P | $267,500 | -- | |
| Hogan Kristine E | $275,500 | -- | |
| Hamson Jenna S | $122,500 | -- |
Source: Public Records
Mortgage History
| Date | Status | Borrower | Loan Amount |
|---|---|---|---|
| Open | Andrews Jessica | $211,000 | |
| Closed | Andrews Ryan P | $246,422 | |
| Closed | Andrews Ryan P | $240,750 | |
| Previous Owner | Hogan Kristine E | $19,700 | |
| Previous Owner | Hamson Jenna S | $253,000 | |
| Previous Owner | Hamson Jenna S | $25,000 | |
| Previous Owner | Hamson Jenna S | $98,000 |
Source: Public Records
Tax History Compared to Growth
Tax History
| Year | Tax Paid | Tax Assessment Tax Assessment Total Assessment is a certain percentage of the fair market value that is determined by local assessors to be the total taxable value of land and additions on the property. | Land | Improvement |
|---|---|---|---|---|
| 2025 | $4,852 | $441,500 | $0 | $441,500 |
| 2024 | $4,650 | $418,500 | $0 | $418,500 |
| 2023 | $4,272 | $363,600 | $0 | $363,600 |
| 2022 | $4,506 | $355,900 | $0 | $355,900 |
| 2021 | $4,830 | $361,800 | $0 | $361,800 |
| 2020 | $4,622 | $353,900 | $0 | $353,900 |
| 2019 | $4,147 | $312,300 | $0 | $312,300 |
| 2018 | $4,479 | $330,800 | $0 | $330,800 |
| 2017 | $4,531 | $319,300 | $0 | $319,300 |
| 2016 | $4,534 | $319,300 | $0 | $319,300 |
| 2015 | $4,245 | $284,700 | $0 | $284,700 |
Source: Public Records
Map
Nearby Homes
- 320 Newbury St Unit 806
- 518 Maple St
- 100 Kirkbride Dr Unit 229
- 100 Kirkbride Dr Unit 227
- 200 North St Unit 11-B
- 200 North St
- 200 North St Unit 7C
- 3 Saratoga Ln
- 40 Village Rd Unit PH4
- 807 Ferncroft Tower Unit 807
- 11 Strawberry Hill Ln
- 38 Village Rd Unit 601
- 38 Village Rd Unit 309
- 36 Village Rd Unit 108
- 38 Reservoir Dr
- 2 Thomas Rd
- 4 Innis Dr
- 4 Chatham Ln
- 11 Alma Ln
- 10 Grace Rd
- 320 Newbury St Unit 403
- 320 Newbury St Unit 1002
- 320 Newbury St Unit 802
- 320 Newbury St Unit 302
- 320 Newbury St Unit 103
- 320 Newbury St Unit 507
- 320 Newbury St Unit 706
- 320 Newbury St Unit 1105
- 320 Newbury St Unit 306
- 320 Newbury St Unit 904
- 320 Newbury St Unit 203
- 320 Newbury St Unit 1102
- 320 Newbury St Unit 902
- 320 Newbury St Unit 401,4
- 320 Newbury St Unit 1101
- 320 Newbury St Unit 201
- 320 Newbury St Unit 903
- 320 Newbury St Unit 702
- 320 Newbury St Unit 701
- 320 Newbury St Unit 402