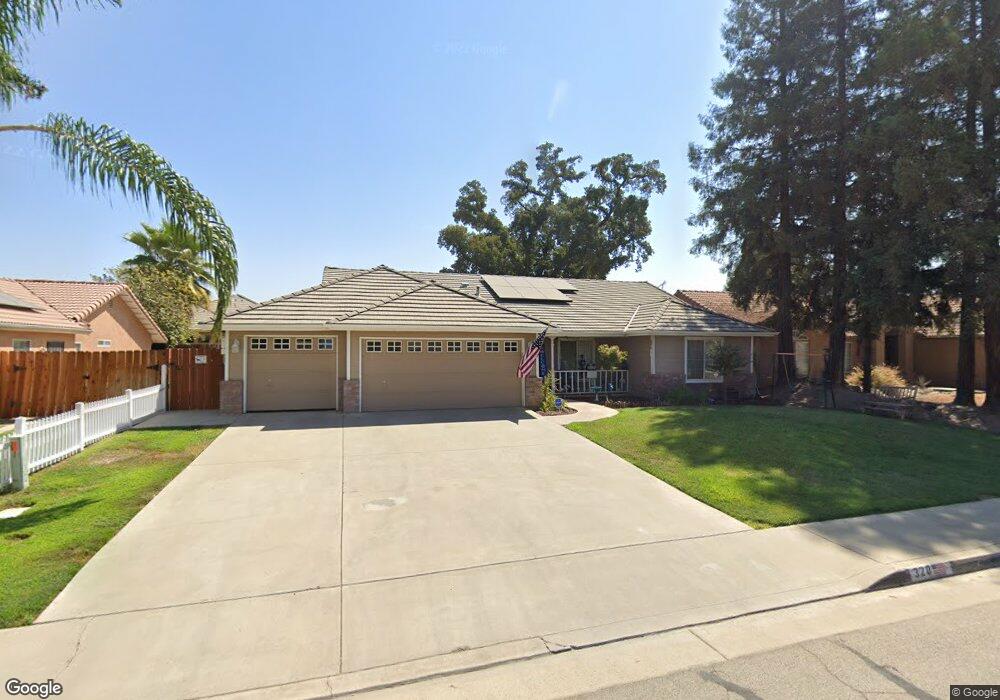
320 S Summit Dr Visalia, CA 93292
Northeast Visalia NeighborhoodEstimated Value: $335,000 - $440,000
4
Beds
2
Baths
1,885
Sq Ft
$211/Sq Ft
Est. Value
About This Home
This home is located at 320 S Summit Dr, Visalia, CA 93292 and is currently estimated at $397,459, approximately $210 per square foot. 320 S Summit Dr is a home located in Tulare County with nearby schools including Mineral King Elementary School, Valley Oak Middle School, and Golden West High School.
Ownership History
Date
Name
Owned For
Owner Type
Purchase Details
Closed on
Apr 9, 2021
Sold by
Perez Adrian Milian and Milian Adrian
Bought by
Milian Edgar and Gutierrez Bertha Alicia
Current Estimated Value
Purchase Details
Closed on
Nov 27, 2013
Sold by
Milian Graciela
Bought by
Milian Adrian
Home Financials for this Owner
Home Financials are based on the most recent Mortgage that was taken out on this home.
Original Mortgage
$154,219
Outstanding Balance
$115,450
Interest Rate
4.25%
Mortgage Type
FHA
Estimated Equity
$282,009
Purchase Details
Closed on
Sep 4, 2012
Sold by
Bank Of America N A
Bought by
The Secretary Of Housing & Urban Develop
Purchase Details
Closed on
Aug 23, 2008
Sold by
Accredited Home Lenders Inc
Bought by
Ford Mark A and Ford Cynthia
Home Financials for this Owner
Home Financials are based on the most recent Mortgage that was taken out on this home.
Original Mortgage
$185,343
Interest Rate
6.27%
Mortgage Type
Seller Take Back
Purchase Details
Closed on
Apr 30, 2008
Sold by
Gomez Edelmiro
Bought by
Mortgage Electronic Registration Systems and Accredited Home Lenders Inc
Purchase Details
Closed on
Jan 30, 2008
Sold by
Gomez Edelmiro
Bought by
Mers and Accredited Home Lenders Inc
Purchase Details
Closed on
Nov 17, 2003
Sold by
Baker Jon S
Bought by
Gomez Edelmiro and Gomez Rosita E
Home Financials for this Owner
Home Financials are based on the most recent Mortgage that was taken out on this home.
Original Mortgage
$162,400
Interest Rate
5.8%
Mortgage Type
Purchase Money Mortgage
Purchase Details
Closed on
Jul 7, 1998
Sold by
Wind David H
Bought by
Baker Jon S and Baker Terri L
Home Financials for this Owner
Home Financials are based on the most recent Mortgage that was taken out on this home.
Original Mortgage
$116,000
Interest Rate
10%
Purchase Details
Closed on
Aug 7, 1996
Sold by
Lawler Mary
Bought by
Tulare Timothy
Home Financials for this Owner
Home Financials are based on the most recent Mortgage that was taken out on this home.
Original Mortgage
$112,000
Interest Rate
7.87%
Purchase Details
Closed on
Jan 18, 1994
Sold by
Sierra Point
Bought by
Sundowner Homes
Home Financials for this Owner
Home Financials are based on the most recent Mortgage that was taken out on this home.
Original Mortgage
$103,500
Interest Rate
7.1%
Mortgage Type
Construction
Create a Home Valuation Report for This Property
The Home Valuation Report is an in-depth analysis detailing your home's value as well as a comparison with similar homes in the area
Home Values in the Area
Average Home Value in this Area
Purchase History
| Date | Buyer | Sale Price | Title Company |
|---|---|---|---|
| Milian Edgar | -- | None Available | |
| Milian Adrian | -- | Chicago Title Company | |
| Milian Adrian | $154,500 | Chicago Title Company | |
| The Secretary Of Housing & Urban Develop | -- | Landsafe Title | |
| Bank Of America N A | $216,228 | Landsafe Title | |
| Ford Mark A | $187,500 | None Available | |
| Mortgage Electronic Registration Systems | $184,500 | Lsi Title Company Ca | |
| Mers | $231,300 | Lsi Title Company | |
| Gomez Edelmiro | $204,000 | Chicago Title Co | |
| Baker Jon S | $145,000 | Chicago Title Co | |
| Tulare Timothy | -- | Chicago Title Co | |
| Sundowner Homes | $33,500 | Chicago Title Company |
Source: Public Records
Mortgage History
| Date | Status | Borrower | Loan Amount |
|---|---|---|---|
| Open | Milian Adrian | $154,219 | |
| Previous Owner | Ford Mark A | $185,343 | |
| Previous Owner | Gomez Edelmiro | $162,400 | |
| Previous Owner | Baker Jon S | $116,000 | |
| Previous Owner | Tulare Timothy | $112,000 | |
| Previous Owner | Sundowner Homes | $103,500 | |
| Closed | Baker Jon S | $21,750 | |
| Closed | Gomez Edelmiro | $40,600 |
Source: Public Records
Tax History
| Year | Tax Paid | Tax Assessment Tax Assessment Total Assessment is a certain percentage of the fair market value that is determined by local assessors to be the total taxable value of land and additions on the property. | Land | Improvement |
|---|---|---|---|---|
| 2025 | $2,154 | $189,390 | $47,194 | $142,196 |
| 2024 | $2,154 | $185,677 | $46,269 | $139,408 |
| 2023 | $2,100 | $182,037 | $45,362 | $136,675 |
| 2022 | $2,015 | $178,469 | $44,473 | $133,996 |
| 2021 | $2,073 | $174,970 | $43,601 | $131,369 |
| 2020 | $2,040 | $173,176 | $43,154 | $130,022 |
| 2019 | $1,975 | $169,781 | $42,308 | $127,473 |
| 2018 | $1,916 | $166,452 | $41,478 | $124,974 |
| 2017 | $1,888 | $163,189 | $40,665 | $122,524 |
| 2016 | $1,844 | $159,990 | $39,868 | $120,122 |
| 2015 | $1,777 | $157,587 | $39,269 | $118,318 |
| 2014 | $1,777 | $154,500 | $38,500 | $116,000 |
Source: Public Records
Map
Nearby Homes
- 352 S Wind Ct
- 3934 E Willow Ave
- 4122 E Kaweah Ave
- 4132 E Kaweah Ave
- 3935 E Myrtle Ave
- 3917 E Myrtle Ave
- 3632 E Willow Ct
- 4016 E Cypress Ave
- 703 S Grand St
- 226 N Amador St
- 4312 E Stapp Ave
- 3934 E College Ave
- 807 S McAuliff St
- 4330 E College Ave
- 4331 E Oak Ave
- 804 S Simon St
- 3646 E Meadow Ct
- 4038 E Sue Ave
- 3148 E Duran Ave
- 212 S Lovers Ln
Your Personal Tour Guide
Ask me questions while you tour the home.