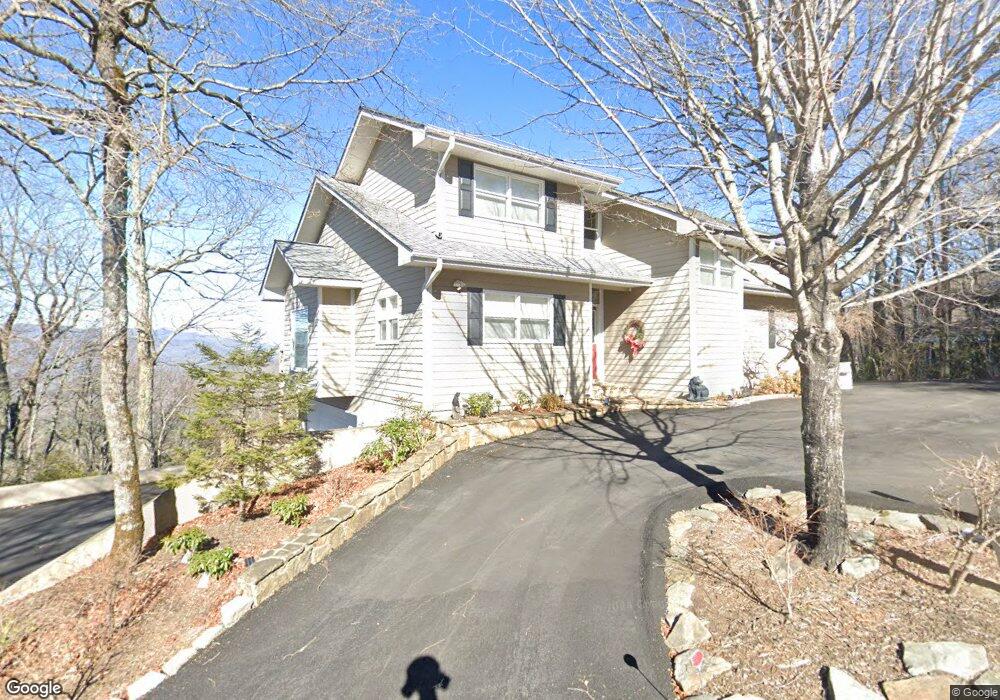
320 Saddleback Cir Unit 74 Dillard, GA 30537
Estimated Value: $711,471 - $985,000
3
Beds
4
Baths
3,141
Sq Ft
$267/Sq Ft
Est. Value
About This Home
This home is located at 320 Saddleback Cir Unit 74, Dillard, GA 30537 and is currently estimated at $838,618, approximately $266 per square foot. 320 Saddleback Cir Unit 74 is a home located in Rabun County with nearby schools including Rabun County Primary School and Rabun County High School.
Ownership History
Date
Name
Owned For
Owner Type
Purchase Details
Closed on
Sep 30, 2020
Sold by
Eddings Donald L
Bought by
Cole Barbara L
Current Estimated Value
Home Financials for this Owner
Home Financials are based on the most recent Mortgage that was taken out on this home.
Original Mortgage
$380,000
Outstanding Balance
$335,690
Interest Rate
2.9%
Mortgage Type
New Conventional
Estimated Equity
$502,928
Purchase Details
Closed on
Aug 11, 2016
Sold by
Margaret B
Bought by
Eddings Donald L and Eddings Margaret B
Purchase Details
Closed on
Jun 29, 2005
Sold by
Eddings Donald L
Bought by
Eddings Margaret B
Purchase Details
Closed on
Aug 1, 2003
Bought by
Eddings Margaret B
Purchase Details
Closed on
Aug 1, 2000
Purchase Details
Closed on
Jun 1, 1986
Purchase Details
Closed on
Feb 1, 1981
Create a Home Valuation Report for This Property
The Home Valuation Report is an in-depth analysis detailing your home's value as well as a comparison with similar homes in the area
Home Values in the Area
Average Home Value in this Area
Purchase History
| Date | Buyer | Sale Price | Title Company |
|---|---|---|---|
| Cole Barbara L | $475,000 | -- | |
| Cole Barbara L | $475,000 | -- | |
| Eddings Donald L | -- | -- | |
| Eddings Donald L | -- | -- | |
| Eddings Margaret B | -- | -- | |
| Eddings Margaret B | -- | -- | |
| Eddings Margaret B | $450,000 | -- | |
| Eddings Margaret B | $450,000 | -- | |
| -- | -- | -- | |
| -- | -- | -- | |
| -- | -- | -- | |
| -- | -- | -- | |
| -- | $7,400 | -- | |
| -- | $7,400 | -- |
Source: Public Records
Mortgage History
| Date | Status | Borrower | Loan Amount |
|---|---|---|---|
| Open | Cole Barbara L | $380,000 | |
| Closed | Cole Barbara L | $380,000 |
Source: Public Records
Tax History
| Year | Tax Paid | Tax Assessment Tax Assessment Total Assessment is a certain percentage of the fair market value that is determined by local assessors to be the total taxable value of land and additions on the property. | Land | Improvement |
|---|---|---|---|---|
| 2025 | $6,653 | $240,859 | $40,000 | $200,859 |
| 2024 | $6,332 | $229,205 | $40,000 | $189,205 |
| 2023 | $6,075 | $194,134 | $32,000 | $162,134 |
| 2022 | $3,242 | $177,116 | $28,000 | $149,116 |
| 2021 | $2,802 | $149,423 | $16,000 | $133,423 |
| 2020 | $2,555 | $131,733 | $13,600 | $118,133 |
| 2019 | $2,573 | $131,733 | $13,600 | $118,133 |
| 2018 | $2,583 | $131,733 | $13,600 | $118,133 |
| 2017 | $2,477 | $131,733 | $13,600 | $118,133 |
| 2016 | $2,483 | $131,733 | $13,600 | $118,133 |
| 2015 | $2,527 | $131,215 | $13,600 | $117,615 |
| 2014 | $2,540 | $131,215 | $13,600 | $117,615 |
Source: Public Records
Map
Nearby Homes
- 291 Saddleback Cir
- 578 Saddleback Cir
- LOT 1 Pleasant Mountain Dr
- 374 W Sugarbush Dr
- 137 Pleasant Mountain Dr
- Lot 1 Ridgepole Dr
- LOT 17 Ridgepole Dr
- 0 LOT 111 Ridgepole Dr
- TBD Ridgepole Dr
- 0 Saddleback Cir Unit 10538862
- 0 Evergreen Ln Unit 10649699
- 0 Evergreen Ln Unit 7662581
- 0 Evergreen Ln Unit 10621047
- 0 Evergreen Ln Unit 7686011
- 119 Buttermilk Cir
- 452 E Sugarbush Dr
- 0 LOT 41 Rebel Cir
- 42 Lost Valley Dr
- 156 Tahoe Ln
- 41 Peek and Peak Dr
- 320 Saddleback Cir
- 308 Saddleback Cir
- 325 Saddleback Cir
- 355 Saddleback Cir
- 292 Saddleback Cir
- 292 Saddleback Cir Unit 76 346
- 292 Saddleback Cir Unit 76
- Lot 71 Saddleback Cir
- 372 Saddleback Cir
- 264 Saddleback Cir
- 241 Saddleback Cir
- 470 Saddleback Cir
- 470 Saddleback Cir Unit 48 & 21
- 502 Saddleback Cir
- 41 Stillwater Ln
- 233 Saddleback Cir
- 233 Saddle Back Cir
- 204 Saddleback Cir
- 520 Saddleback Cir
- 520 Saddleback Cir Unit 9
Your Personal Tour Guide
Ask me questions while you tour the home.