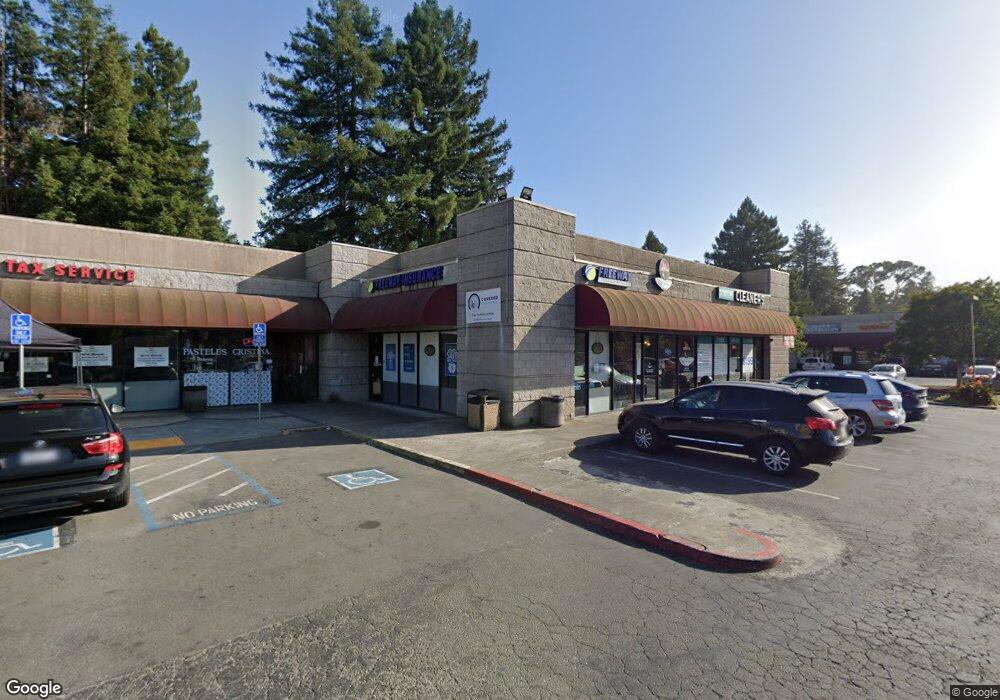
320 W 3rd St Unit G Santa Rosa, CA 95401
--
Bed
--
Bath
1,341
Sq Ft
1.39
Acres
About This Home
This home is located at 320 W 3rd St Unit G, Santa Rosa, CA 95401. 320 W 3rd St Unit G is a home located in Sonoma County with nearby schools including Elsie Allen High School, Kid Street Charter School, and St. Michael's Orthodox School.
Ownership History
Date
Name
Owned For
Owner Type
Purchase Details
Closed on
Sep 3, 1999
Sold by
G K Hardt Development Co
Bought by
Hkv Associates Llc
Home Financials for this Owner
Home Financials are based on the most recent Mortgage that was taken out on this home.
Original Mortgage
$1,085,000
Outstanding Balance
$317,713
Interest Rate
7.66%
Mortgage Type
Commercial
Purchase Details
Closed on
Apr 1, 1994
Sold by
Shu Grace
Bought by
Shu Frank
Create a Home Valuation Report for This Property
The Home Valuation Report is an in-depth analysis detailing your home's value as well as a comparison with similar homes in the area
Home Values in the Area
Average Home Value in this Area
Purchase History
| Date | Buyer | Sale Price | Title Company |
|---|---|---|---|
| Hkv Associates Llc | $1,550,000 | Sonoma Title Guaranty Compan | |
| Shu Frank | -- | -- |
Source: Public Records
Mortgage History
| Date | Status | Borrower | Loan Amount |
|---|---|---|---|
| Open | Hkv Associates Llc | $1,085,000 |
Source: Public Records
Tax History Compared to Growth
Tax History
| Year | Tax Paid | Tax Assessment Tax Assessment Total Assessment is a certain percentage of the fair market value that is determined by local assessors to be the total taxable value of land and additions on the property. | Land | Improvement |
|---|---|---|---|---|
| 2025 | $27,463 | $2,382,385 | $845,358 | $1,537,027 |
| 2024 | $27,463 | $2,335,673 | $828,783 | $1,506,890 |
| 2023 | $27,463 | $2,289,877 | $812,533 | $1,477,344 |
| 2022 | $25,896 | $2,244,978 | $796,601 | $1,448,377 |
| 2021 | $25,554 | $2,200,960 | $780,982 | $1,419,978 |
| 2020 | $24,885 | $2,178,392 | $772,974 | $1,405,418 |
| 2019 | $24,575 | $2,135,679 | $757,818 | $1,377,861 |
| 2018 | $24,341 | $2,093,804 | $742,959 | $1,350,845 |
| 2017 | $23,817 | $2,052,750 | $728,392 | $1,324,358 |
| 2016 | $23,675 | $2,012,501 | $714,110 | $1,298,391 |
| 2015 | $22,947 | $1,982,272 | $703,384 | $1,278,888 |
| 2014 | $21,968 | $1,943,443 | $689,606 | $1,253,837 |
Source: Public Records
Map
Nearby Homes