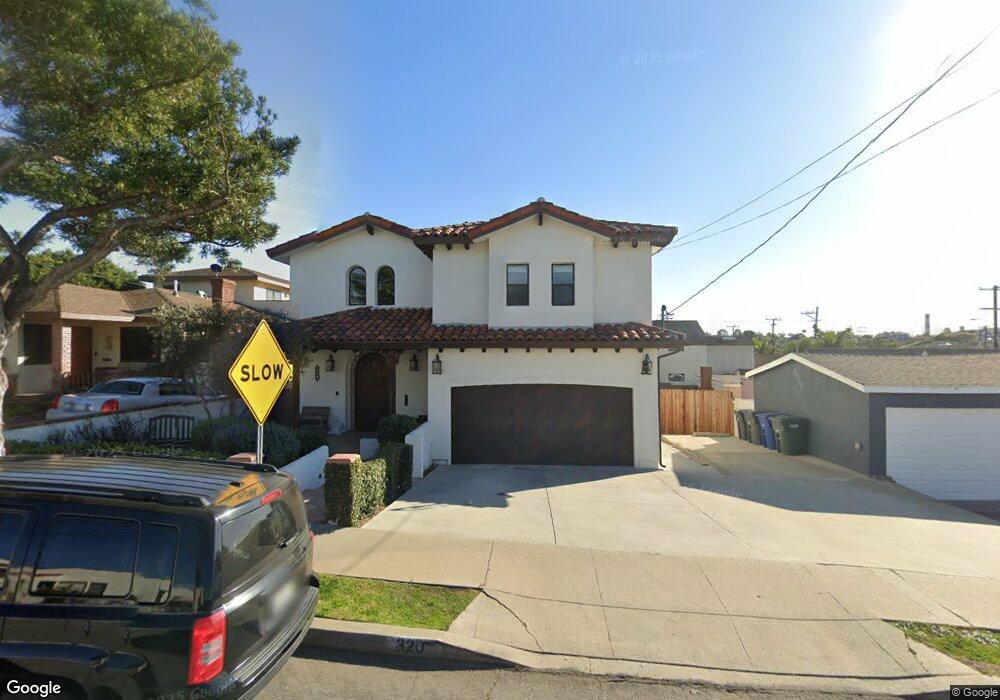
320 W Sycamore Ave El Segundo, CA 90245
Estimated Value: $1,595,000 - $2,827,509
3
Beds
1
Bath
1,268
Sq Ft
$1,735/Sq Ft
Est. Value
About This Home
This home is located at 320 W Sycamore Ave, El Segundo, CA 90245 and is currently estimated at $2,199,377, approximately $1,734 per square foot. 320 W Sycamore Ave is a home located in Los Angeles County with nearby schools including Richmond Street Elementary School, El Segundo Middle School, and El Segundo High School.
Ownership History
Date
Name
Owned For
Owner Type
Purchase Details
Closed on
Oct 6, 2016
Sold by
Bennett Danielle Curls
Bought by
Bennett Danielle Curls and Bennett Ii Paul
Current Estimated Value
Home Financials for this Owner
Home Financials are based on the most recent Mortgage that was taken out on this home.
Original Mortgage
$1,000,000
Outstanding Balance
$801,687
Interest Rate
3.46%
Mortgage Type
New Conventional
Estimated Equity
$1,397,690
Purchase Details
Closed on
Mar 7, 2006
Sold by
Taef James and Curls Danielle M
Bought by
Curls Danielle M
Home Financials for this Owner
Home Financials are based on the most recent Mortgage that was taken out on this home.
Original Mortgage
$325,000
Interest Rate
6.18%
Mortgage Type
New Conventional
Purchase Details
Closed on
Jun 8, 1995
Sold by
Wright Timothy J and Wright Ute A
Bought by
Taef James
Home Financials for this Owner
Home Financials are based on the most recent Mortgage that was taken out on this home.
Original Mortgage
$228,000
Interest Rate
7.88%
Create a Home Valuation Report for This Property
The Home Valuation Report is an in-depth analysis detailing your home's value as well as a comparison with similar homes in the area
Home Values in the Area
Average Home Value in this Area
Purchase History
| Date | Buyer | Sale Price | Title Company |
|---|---|---|---|
| Bennett Danielle Curls | -- | Servicelink | |
| Curls Danielle M | -- | Accommodation | |
| Taef James | $240,000 | Gateway Title Company |
Source: Public Records
Mortgage History
| Date | Status | Borrower | Loan Amount |
|---|---|---|---|
| Open | Bennett Danielle Curls | $1,000,000 | |
| Closed | Curls Danielle M | $325,000 | |
| Closed | Taef James | $228,000 |
Source: Public Records
Tax History Compared to Growth
Tax History
| Year | Tax Paid | Tax Assessment Tax Assessment Total Assessment is a certain percentage of the fair market value that is determined by local assessors to be the total taxable value of land and additions on the property. | Land | Improvement |
|---|---|---|---|---|
| 2025 | $8,350 | $734,318 | $322,491 | $411,827 |
| 2024 | $8,350 | $719,920 | $316,168 | $403,752 |
| 2023 | $8,137 | $705,805 | $309,969 | $395,836 |
| 2022 | $8,219 | $691,967 | $303,892 | $388,075 |
| 2021 | $8,085 | $678,400 | $297,934 | $380,466 |
| 2019 | $7,661 | $644,948 | $289,099 | $355,849 |
| 2018 | $7,138 | $632,303 | $283,431 | $348,872 |
| 2016 | $6,890 | $607,752 | $272,426 | $335,326 |
| 2015 | $6,805 | $598,624 | $268,334 | $330,290 |
| 2014 | $6,664 | $586,899 | $263,078 | $323,821 |
Source: Public Records
Map
Nearby Homes
- 125 W Sycamore Ave
- 505 W Maple Ave
- 745 Main St Unit 107
- 900 Cedar St Unit 308
- 836 Loma Vista St
- 955 Virginia St
- 935 Main St Unit 303
- 724 Loma Vista St
- 950 Main St Unit 205
- 212 E Imperial Ave Unit A
- 212 E Imperial Ave Unit E
- 329 E Maple Ave
- 931 Hillcrest St
- 426 E Imperial Ave
- 926 Fairing Place
- 848 Penn St
- 360 Hillcrest St
- 574 E Imperial Ave
- 516 Penn St
- 906 E Imperial Ave
- 316 W Sycamore Ave
- 826 Virginia St
- 818 Virginia St
- 324 W Sycamore Ave
- 814 Virginia St
- 821 Concord Place
- 300 W Sycamore Ave
- 817 Concord Place
- 317 W Maple Ave
- 810 Virginia St
- 313 W Maple Ave
- 811 Concord Place
- 832 Virginia St
- 319 W Sycamore Ave
- 317 W Sycamore Ave
- 807 Concord Place
- 800 Virginia St
- 842 Virginia St
- 230 W Sycamore Ave
- 309 W Sycamore Ave