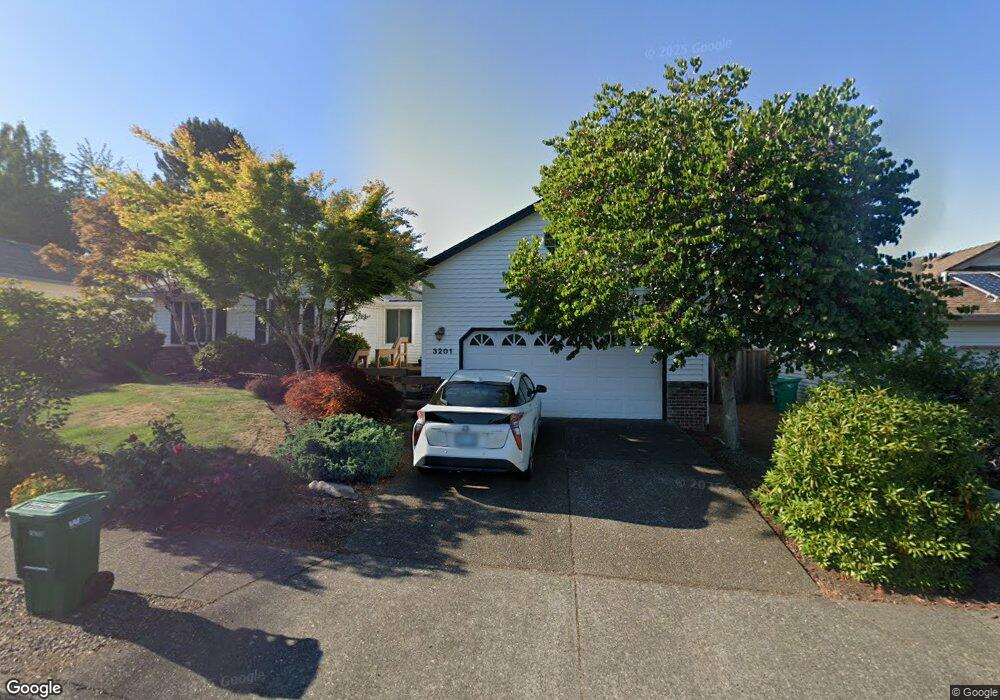
3201 SW 31st St Gresham, OR 97080
Southwest Gresham NeighborhoodEstimated Value: $499,065 - $563,000
4
Beds
2
Baths
1,876
Sq Ft
$284/Sq Ft
Est. Value
About This Home
This home is located at 3201 SW 31st St, Gresham, OR 97080 and is currently estimated at $532,516, approximately $283 per square foot. 3201 SW 31st St is a home located in Multnomah County with nearby schools including Butler Creek Elementary School, Centennial Middle School, and Centennial High School.
Ownership History
Date
Name
Owned For
Owner Type
Purchase Details
Closed on
Feb 9, 2010
Sold by
Kirkpatrick C Rodney
Bought by
Kennedy James A and Gutman Diane
Current Estimated Value
Home Financials for this Owner
Home Financials are based on the most recent Mortgage that was taken out on this home.
Original Mortgage
$196,800
Outstanding Balance
$130,256
Interest Rate
5.11%
Mortgage Type
New Conventional
Estimated Equity
$402,260
Purchase Details
Closed on
Aug 18, 1998
Sold by
Ash Michael C and Ash Mary M
Bought by
Kirkpatrick C Rodney and Kirkpatrick Suzanne M
Home Financials for this Owner
Home Financials are based on the most recent Mortgage that was taken out on this home.
Original Mortgage
$162,000
Interest Rate
6.89%
Mortgage Type
Purchase Money Mortgage
Purchase Details
Closed on
Oct 6, 1997
Sold by
Ash Michael C
Bought by
Ash Mary M
Create a Home Valuation Report for This Property
The Home Valuation Report is an in-depth analysis detailing your home's value as well as a comparison with similar homes in the area
Home Values in the Area
Average Home Value in this Area
Purchase History
| Date | Buyer | Sale Price | Title Company |
|---|---|---|---|
| Kennedy James A | $246,000 | First American | |
| Kirkpatrick C Rodney | $202,950 | First American Title Ins Co | |
| Ash Mary M | -- | Chicago Title Insurance Co |
Source: Public Records
Mortgage History
| Date | Status | Borrower | Loan Amount |
|---|---|---|---|
| Open | Kennedy James A | $196,800 | |
| Previous Owner | Kirkpatrick C Rodney | $162,000 | |
| Closed | Kirkpatrick C Rodney | $20,250 |
Source: Public Records
Tax History
| Year | Tax Paid | Tax Assessment Tax Assessment Total Assessment is a certain percentage of the fair market value that is determined by local assessors to be the total taxable value of land and additions on the property. | Land | Improvement |
|---|---|---|---|---|
| 2025 | $5,860 | $309,430 | -- | -- |
| 2024 | $5,612 | $300,420 | -- | -- |
| 2023 | $5,053 | $291,670 | $0 | $0 |
| 2022 | $4,867 | $283,180 | $0 | $0 |
| 2021 | $4,885 | $274,940 | $0 | $0 |
| 2020 | $4,497 | $266,940 | $0 | $0 |
| 2019 | $4,388 | $259,170 | $0 | $0 |
| 2018 | $4,209 | $251,630 | $0 | $0 |
| 2017 | $4,068 | $244,310 | $0 | $0 |
| 2016 | $3,949 | $237,200 | $0 | $0 |
Source: Public Records
Map
Nearby Homes
- 3544 SW Tegart Ln
- 3519 SW 28th Terrace
- 3510 SW Binford Ave
- 3737 SW Redfern Ave
- 3542 SW Binford Ave
- 3503 SW Battaglia Ave
- 3539 SW Battaglia Ave
- 3506 SW Battaglia Ave
- 3576 SW 36th St
- 2607 SW Pleasant View Dr
- 3512 SW Battaglia Ave
- 3536 SW Battaglia Ave
- 3565 SW 37th St
- 3549 SW Thomas Ave
- 3563 SW Thomas Ave
- 3506 SW Hartley Ave
- 3575 SW Thomas Ave
- 3582 SW Battaglia Ave
- 3650 SW Binford Ave
- 3558 SW Battaglia Ave
- 3181 SW 31st St
- 3231 SW 31st St
- 3206 SW 30th St
- 3136 SW 30th St
- 3131 SW 31st St
- 3241 SW 31st St
- 3220 SW 31st $1000 Bonus
- 3220 SW 31st St
- 3180 SW 31st St
- 3218 SW 30th St
- 3122 SW 30th St
- 3240 SW 31st St
- 3130 SW 31st St
- 3142 SW 38th St
- 3261 SW 31st St
- 3121 SW 31st St
- 2938 SW Tegart Ave
- 3260 SW 31st St
- 3177 SW Tegart Ave
- 3176 SW Tegart Ave
Your Personal Tour Guide
Ask me questions while you tour the home.