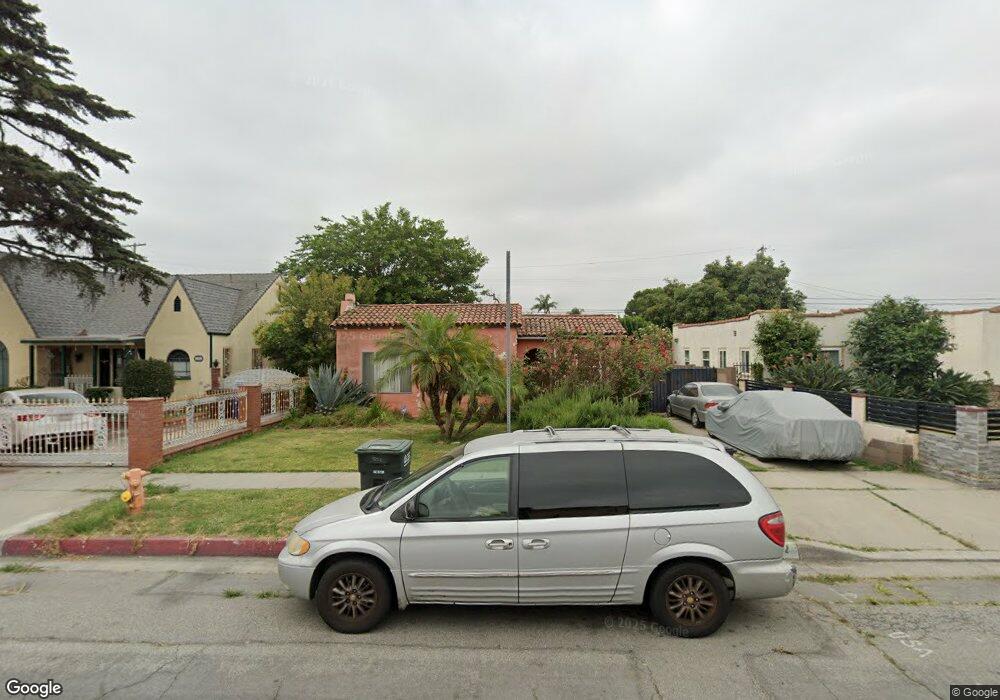
3202 Hope St Huntington Park, CA 90255
Estimated Value: $679,572 - $760,000
3
Beds
2
Baths
1,507
Sq Ft
$481/Sq Ft
Est. Value
About This Home
This home is located at 3202 Hope St, Huntington Park, CA 90255 and is currently estimated at $724,393, approximately $480 per square foot. 3202 Hope St is a home located in Los Angeles County with nearby schools including Hope Street Elementary School, Henry T. Gage Middle School, and Huntington Park Senior High School.
Ownership History
Date
Name
Owned For
Owner Type
Purchase Details
Closed on
Sep 11, 2003
Sold by
Lugo Albert and Lugo Esther
Bought by
Aguila Juan M
Current Estimated Value
Home Financials for this Owner
Home Financials are based on the most recent Mortgage that was taken out on this home.
Original Mortgage
$204,000
Interest Rate
6.99%
Mortgage Type
Purchase Money Mortgage
Purchase Details
Closed on
Sep 4, 2002
Sold by
Lopez Maria
Bought by
Lugo Albert
Purchase Details
Closed on
Mar 2, 1999
Sold by
Muszynski Patricia
Bought by
Muszynski Andrew Z
Purchase Details
Closed on
Dec 8, 1998
Sold by
Muszynski Andrew Z
Bought by
Lopez Maria
Home Financials for this Owner
Home Financials are based on the most recent Mortgage that was taken out on this home.
Original Mortgage
$145,512
Interest Rate
6.76%
Mortgage Type
FHA
Create a Home Valuation Report for This Property
The Home Valuation Report is an in-depth analysis detailing your home's value as well as a comparison with similar homes in the area
Home Values in the Area
Average Home Value in this Area
Purchase History
| Date | Buyer | Sale Price | Title Company |
|---|---|---|---|
| Aguila Juan M | $255,000 | Old Republic Title Company | |
| Lugo Albert | $250,000 | Southland Title | |
| Muszynski Andrew Z | -- | Fidelity National Title Ins | |
| Lopez Maria | $140,000 | Fidelity National Title Ins |
Source: Public Records
Mortgage History
| Date | Status | Borrower | Loan Amount |
|---|---|---|---|
| Previous Owner | Aguila Juan M | $204,000 | |
| Previous Owner | Lopez Maria | $145,512 | |
| Closed | Aguila Juan M | $51,000 |
Source: Public Records
Tax History Compared to Growth
Tax History
| Year | Tax Paid | Tax Assessment Tax Assessment Total Assessment is a certain percentage of the fair market value that is determined by local assessors to be the total taxable value of land and additions on the property. | Land | Improvement |
|---|---|---|---|---|
| 2025 | $5,638 | $362,538 | $236,577 | $125,961 |
| 2024 | $5,638 | $355,431 | $231,939 | $123,492 |
| 2023 | $5,537 | $348,463 | $227,392 | $121,071 |
| 2022 | $5,296 | $341,632 | $222,934 | $118,698 |
| 2021 | $5,222 | $334,934 | $218,563 | $116,371 |
| 2019 | $5,054 | $325,001 | $212,081 | $112,920 |
| 2018 | $4,926 | $318,629 | $207,923 | $110,706 |
| 2016 | $4,701 | $306,258 | $199,850 | $106,408 |
| 2015 | $4,624 | $301,659 | $196,849 | $104,810 |
| 2014 | $4,610 | $295,750 | $192,993 | $102,757 |
Source: Public Records
Map
Nearby Homes
- 3152 Olive St
- 3245 Live Oak St
- 3107 Hill St
- 3241 Santa Ana St
- 3007 Flower St
- 3037 Cudahy St
- 8126 S Gate Ave
- 2930 Live Oak St
- 2912 Hill St
- 6913 Plaska Ave
- 2829 California St
- 2742 Olive St
- 2806 Cudahy St
- 2749 Live Oak St
- 2712 California St
- 3510 Nevada St
- 8600 S Gate Ave
- 7015 Templeton St
- 7126 Stafford Ave
- 3900 Florence Ave