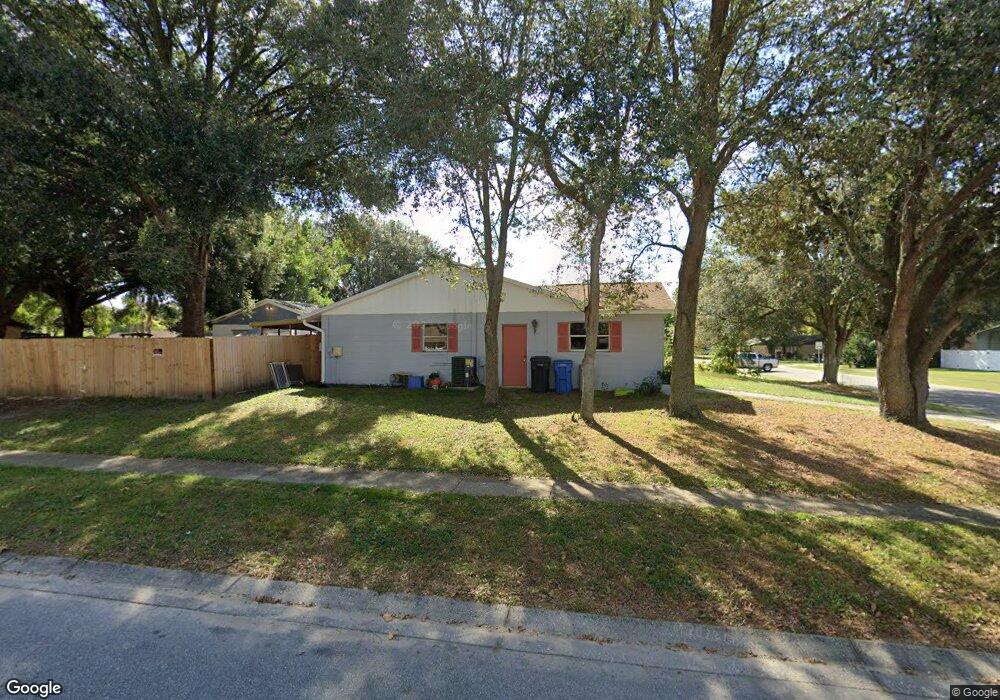
3202 King Charles Cir Seffner, FL 33584
Estimated Value: $352,000 - $367,000
3
Beds
2
Baths
1,636
Sq Ft
$218/Sq Ft
Est. Value
About This Home
This home is located at 3202 King Charles Cir, Seffner, FL 33584 and is currently estimated at $357,208, approximately $218 per square foot. 3202 King Charles Cir is a home located in Hillsborough County with nearby schools including Seffner Elementary School, Mann Middle School, and Brandon High School.
Ownership History
Date
Name
Owned For
Owner Type
Purchase Details
Closed on
Jun 7, 2017
Sold by
Rydzewski Joanna H
Bought by
Rydzewski Joanna H
Current Estimated Value
Purchase Details
Closed on
Dec 19, 2003
Sold by
Kayston Patricia Agnes
Bought by
Kayston Patricia Agnes
Home Financials for this Owner
Home Financials are based on the most recent Mortgage that was taken out on this home.
Original Mortgage
$76,150
Outstanding Balance
$35,262
Interest Rate
5.87%
Mortgage Type
Unknown
Estimated Equity
$321,946
Purchase Details
Closed on
Apr 10, 2002
Sold by
Hayston Patricia A
Bought by
Hayston Patricia A Trust
Purchase Details
Closed on
May 9, 1996
Sold by
Goff Robert M and Goff C
Bought by
Hayston Daniel J and Hayston Patricia A
Home Financials for this Owner
Home Financials are based on the most recent Mortgage that was taken out on this home.
Original Mortgage
$76,227
Interest Rate
7.67%
Mortgage Type
FHA
Create a Home Valuation Report for This Property
The Home Valuation Report is an in-depth analysis detailing your home's value as well as a comparison with similar homes in the area
Home Values in the Area
Average Home Value in this Area
Purchase History
| Date | Buyer | Sale Price | Title Company |
|---|---|---|---|
| Rydzewski Joanna H | -- | Attorney | |
| Kayston Patricia Agnes | -- | Title Source | |
| Kayston Patricia Agnes | -- | Title Source Inc | |
| Hayston Patricia A Trust | -- | -- | |
| Hayston Daniel J | $76,500 | -- |
Source: Public Records
Mortgage History
| Date | Status | Borrower | Loan Amount |
|---|---|---|---|
| Open | Kayston Patricia Agnes | $76,150 | |
| Previous Owner | Hayston Daniel J | $76,227 |
Source: Public Records
Tax History Compared to Growth
Tax History
| Year | Tax Paid | Tax Assessment Tax Assessment Total Assessment is a certain percentage of the fair market value that is determined by local assessors to be the total taxable value of land and additions on the property. | Land | Improvement |
|---|---|---|---|---|
| 2024 | $4,688 | $236,179 | $77,173 | $159,006 |
| 2023 | $4,370 | $229,135 | $77,173 | $151,962 |
| 2022 | $4,163 | $247,324 | $71,237 | $176,087 |
| 2021 | $3,604 | $174,087 | $50,459 | $123,628 |
| 2020 | $3,366 | $163,107 | $44,523 | $118,584 |
| 2019 | $3,188 | $154,735 | $35,618 | $119,117 |
| 2018 | $3,137 | $151,519 | $0 | $0 |
| 2017 | $2,508 | $123,678 | $0 | $0 |
| 2016 | $2,292 | $102,423 | $0 | $0 |
| 2015 | $2,145 | $93,112 | $0 | $0 |
| 2014 | $1,963 | $84,647 | $0 | $0 |
| 2013 | -- | $76,952 | $0 | $0 |
Source: Public Records
Map
Nearby Homes
- 3410 King Richard Ct
- 3509 King George Ln
- 306 Hollowtree Dr
- 1306 Cottage Place
- 422 Mahogany Dr
- 318 Hollowtree Dr
- 608 Chilt Dr
- 1305 Willow Valley Dr
- 1304 Seffner Valrico Rd
- 423 Forest Oak Dr
- 3104 Apricot St
- 2602 Elm St
- 1052 Malletwood Dr
- 310 Terrace Dr
- 2902 Beagle Place
- 107 Valley Cir
- 217 Faithway Dr
- 408 Blueberry Ln
- 147 Melanie Ln
- 101 Sheryl Lynn Dr
- 3204 King Charles Cir
- 3305 King Richard Ct
- 3304 King Richard Ct
- 3206 King Charles Cir
- 3302 King Richard Ct
- 3201 King Charles Cir
- 3327 King Charles Cir Unit 3
- 3317 King William Cir Unit 1
- 3307 King Richard Ct
- 3218 King Richard Ct
- 3205 King Charles Cir
- 3213 King Richard Ct
- 3315 King William Cir
- 3216 King Richard Ct
- 3325 King Charles Cir
- 3305 King William Cir
- 3309 King Richard Ct
- 3303 King William Cir
- 3330 King Charles Cir