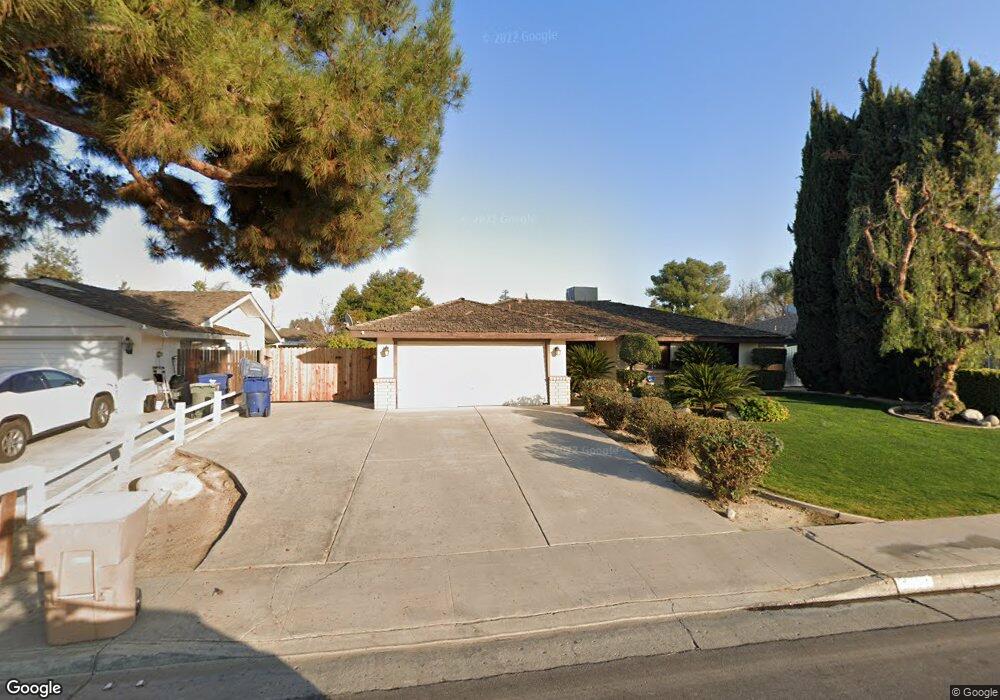
3204 Pendleton Ct Bakersfield, CA 93309
Laurelglen NeighborhoodEstimated Value: $342,000 - $391,000
3
Beds
2
Baths
1,485
Sq Ft
$249/Sq Ft
Est. Value
About This Home
This home is located at 3204 Pendleton Ct, Bakersfield, CA 93309 and is currently estimated at $369,565, approximately $248 per square foot. 3204 Pendleton Ct is a home located in Kern County with nearby schools including Laurelglen Elementary School, Tevis Junior High School, and Bakersfield High School.
Ownership History
Date
Name
Owned For
Owner Type
Purchase Details
Closed on
Mar 17, 2010
Sold by
Abend Jon and Abend Helen N
Bought by
Courtis Shane
Current Estimated Value
Home Financials for this Owner
Home Financials are based on the most recent Mortgage that was taken out on this home.
Original Mortgage
$166,822
Outstanding Balance
$112,699
Interest Rate
5.37%
Mortgage Type
FHA
Estimated Equity
$256,866
Purchase Details
Closed on
Sep 18, 2002
Sold by
Wardell Jay R
Bought by
Abend Jon and Tarter Abend Helen
Home Financials for this Owner
Home Financials are based on the most recent Mortgage that was taken out on this home.
Original Mortgage
$120,800
Interest Rate
5.99%
Purchase Details
Closed on
Jan 30, 1998
Sold by
Wardell Jay R and Wardell Cathi R
Bought by
Wardell Jay R
Create a Home Valuation Report for This Property
The Home Valuation Report is an in-depth analysis detailing your home's value as well as a comparison with similar homes in the area
Home Values in the Area
Average Home Value in this Area
Purchase History
| Date | Buyer | Sale Price | Title Company |
|---|---|---|---|
| Courtis Shane | $170,000 | Placer Title Company | |
| Abend Jon | $151,000 | First American Title | |
| Wardell Jay R | -- | -- |
Source: Public Records
Mortgage History
| Date | Status | Borrower | Loan Amount |
|---|---|---|---|
| Open | Courtis Shane | $166,822 | |
| Previous Owner | Abend Jon | $120,800 | |
| Closed | Abend Jon | $15,100 |
Source: Public Records
Tax History
| Year | Tax Paid | Tax Assessment Tax Assessment Total Assessment is a certain percentage of the fair market value that is determined by local assessors to be the total taxable value of land and additions on the property. | Land | Improvement |
|---|---|---|---|---|
| 2025 | $3,223 | $219,424 | $51,627 | $167,797 |
| 2024 | $3,172 | $215,122 | $50,615 | $164,507 |
| 2023 | $3,172 | $210,905 | $49,623 | $161,282 |
| 2022 | $3,043 | $206,770 | $48,650 | $158,120 |
| 2021 | $2,926 | $202,717 | $47,697 | $155,020 |
| 2020 | $2,873 | $200,639 | $47,208 | $153,431 |
| 2019 | $2,835 | $200,639 | $47,208 | $153,431 |
| 2018 | $2,708 | $192,850 | $45,376 | $147,474 |
| 2017 | $2,668 | $189,070 | $44,487 | $144,583 |
| 2016 | $2,497 | $185,364 | $43,615 | $141,749 |
| 2015 | $2,474 | $182,580 | $42,960 | $139,620 |
| 2014 | $2,413 | $179,005 | $42,119 | $136,886 |
Source: Public Records
Map
Nearby Homes
- 3012 Pendleton Ct
- 3105 Loveland Way
- 7321 Alamosa Ln
- 7108 Wilford Ct
- 3009 Buford Way
- 6512 Chewacan Dr
- 7001 Margaret Ct
- 6808 N Half Moon Dr
- 6601 Chelan Ct
- 3108 Corvallis Ln
- 7504 Deming Ct
- 2512 Moffitt Way
- 2601 Manitou Way
- 2508 Moffitt Way
- 2601 Barrington St
- 2704 El Portal Dr
- 7512 Lordsburg Dr
- 6901 Shelby Loop
- 7401 Hilton Head Way Unit 21
- 7713 Kamloops Dr
- 3208 Pendleton Ct
- 3200 Pendleton Ct
- 3205 Corvallis Ct
- 3300 Pendleton Ct
- 3201 Corvallis Ct
- 3209 Corvallis Ct
- 3205 Pendleton Ct
- 3209 Pendleton Ct
- 3201 Pendleton Ct
- 3116 Pendleton Ct
- 3213 Corvallis Ct
- 3304 Pendleton Ct
- 3301 Pendleton Ct
- 3121 Corvallis Ct
- 3305 Pendleton Ct
- 3117 Pendleton Ct
- 3112 Pendleton Ct
- 3308 Pendleton Ct
- 3204 Corvallis Ct
- 3117 Corvallis Ct
Your Personal Tour Guide
Ask me questions while you tour the home.