C
Landlord's Agent in 2020
Claudia Moreno
Home & Ranch Real Estate
(979) 272-1759
105 Total Sales


Estimated Value: $178,000 - $212,000
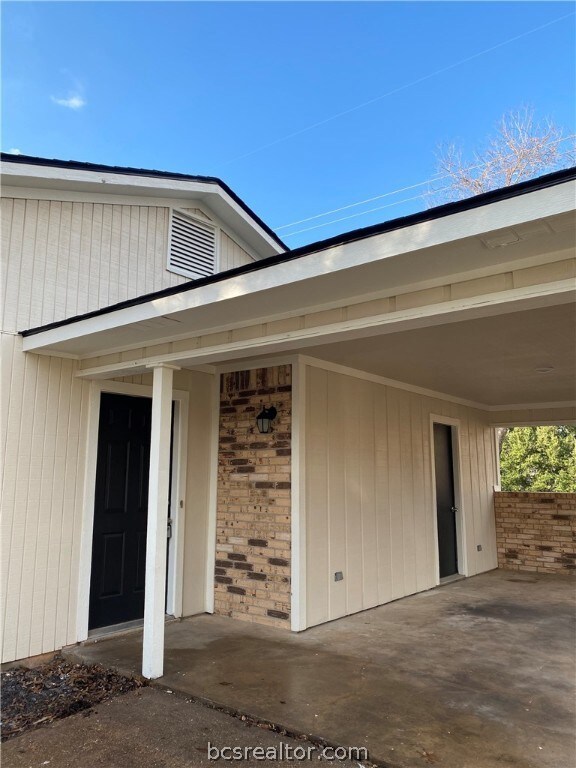
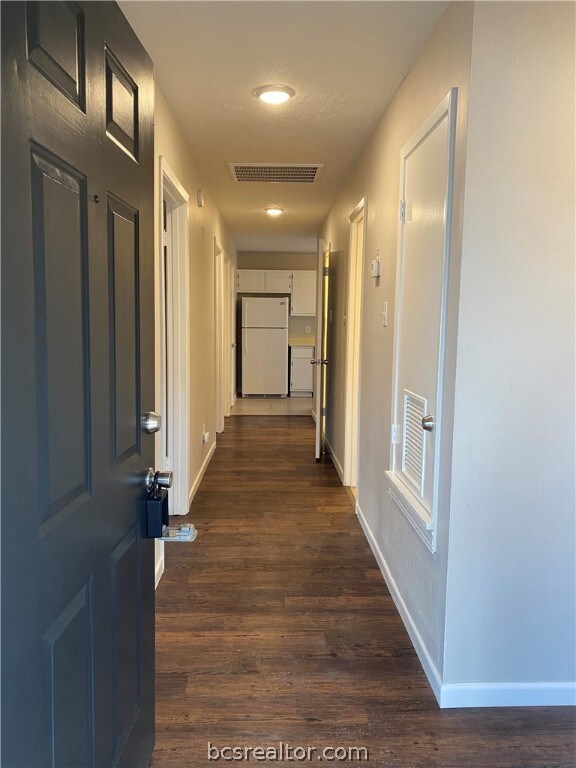
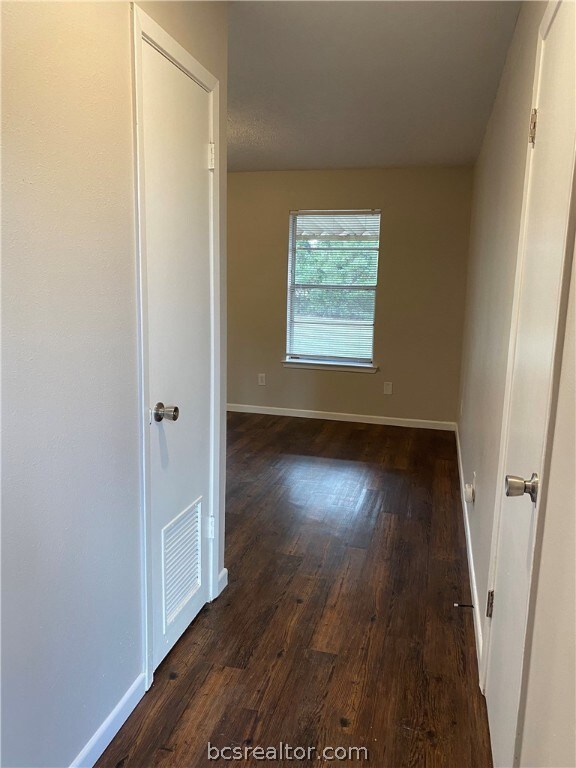
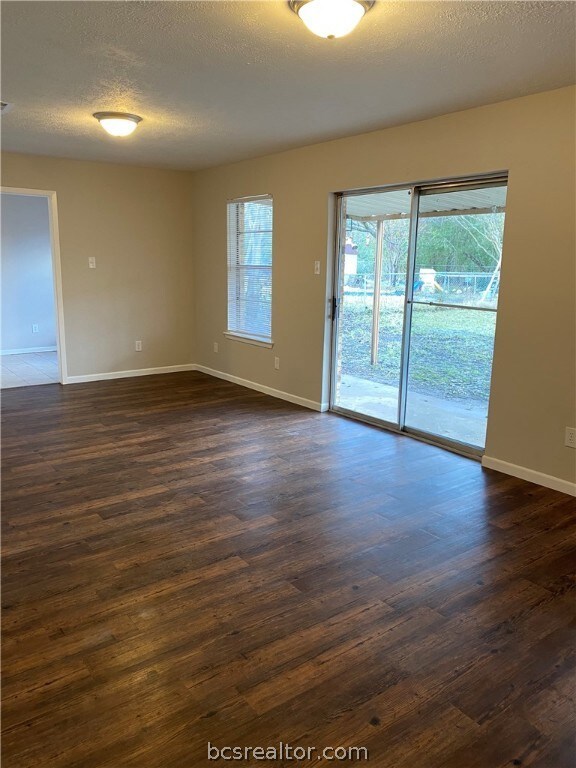
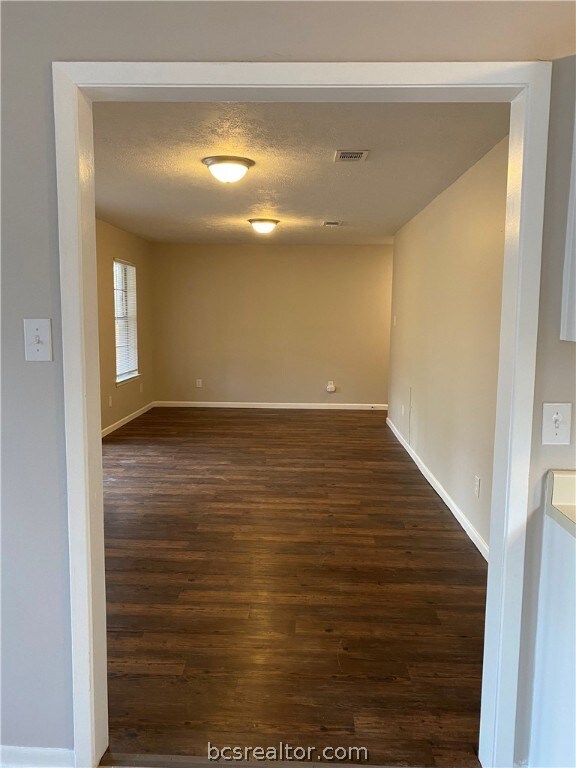
AVAILABLE NOW. Darling 3 bed with 1 + half bath home sits on a quiet street. Recently remodeled: new paint throughout, central A/C, roof, and flooring. Enjoy a huge back yard, fully fenced, and covered patio. Attached carport with a storage closet.
Location, location - just two blocks away from the Bryan Town Shopping Center with Target, Cracker Barrel, and emergency clinic, and is a few minutes drive from Kroger’s, Walmart, and Bryan Premiere Cinema. Definitely don't want to miss this awesome opportunity!
Last Agent to Rent the Property
Home & Ranch Real Estate License #0718958 Listed on: 12/19/2020
| Date | Buyer | Sale Price | Title Company |
|---|---|---|---|
| Z & M Llc | -- | None Available | |
| Nitya Housing Propco Llc | -- | None Available |
| Date | Event | Price | List to Sale | Price per Sq Ft | Prior Sale |
|---|---|---|---|---|---|
| 12/19/2020 12/19/20 | For Rent | $1,100 | -6.4% | -- | |
| 12/19/2020 12/19/20 | Rented | $1,175 | 0.0% | -- | |
| 12/01/2020 12/01/20 | Sold | -- | -- | -- | View Prior Sale |
| 11/01/2020 11/01/20 | Pending | -- | -- | -- | |
| 10/10/2020 10/10/20 | For Sale | $109,900 | -- | $90 / Sq Ft |
| Year | Tax Paid | Tax Assessment Tax Assessment Total Assessment is a certain percentage of the fair market value that is determined by local assessors to be the total taxable value of land and additions on the property. | Land | Improvement |
|---|---|---|---|---|
| 2025 | $3,749 | $181,898 | $43,000 | $138,898 |
| 2024 | $3,749 | $188,346 | $42,000 | $146,346 |
| 2023 | $3,749 | $185,500 | $38,500 | $147,000 |
| 2022 | $3,425 | $156,170 | $35,000 | $121,170 |
| 2021 | $3,104 | $131,719 | $35,000 | $96,719 |
| 2020 | $3,067 | $127,906 | $35,000 | $92,906 |
| 2019 | $2,906 | $118,370 | $35,000 | $83,370 |
| 2018 | $2,749 | $111,960 | $35,000 | $76,960 |
| 2017 | $2,494 | $101,170 | $35,000 | $66,170 |
| 2016 | $2,460 | $99,790 | $30,000 | $69,790 |
C
Landlord's Agent in 2020
Claudia Moreno
Home & Ranch Real Estate
(979) 272-1759
105 Total Sales

Seller's Agent in 2020
Farhan Ajanee
Pinnacle Realty Advisors
(832) 497-2181
209 Total Sales
Tenant's Agent in 2020
Chad Hovde
NON MEMBERS
(979) 383-2020
7,925 Total Sales
Source: Bryan-College Station Regional Multiple Listing Service
MLS Number: 20018801
APN: 19460
Disclaimer: Certain information contained herein is derived from information provided by parties other than Homes.com. All information provided is deemed reliable, but is not guaranteed to be accurate and should be independently verified.
![]() IDX information is provided exclusively for personal, non-commercial use, and may not be used for any purpose other than to identify prospective properties consumers may be interested in purchasing.
IDX information is provided exclusively for personal, non-commercial use, and may not be used for any purpose other than to identify prospective properties consumers may be interested in purchasing.
Information is deemed reliable but not guaranteed.
Ask me questions while you tour the home.