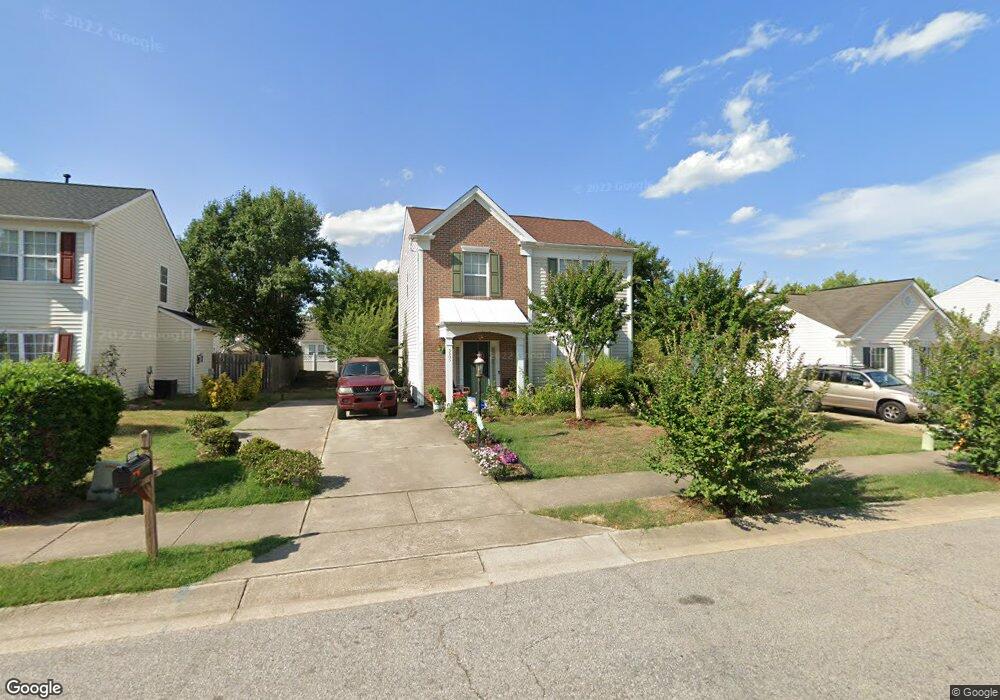
3205 Tuckland Dr Raleigh, NC 27610
Estimated Value: $277,143 - $325,000
Studio
3
Baths
1,366
Sq Ft
$223/Sq Ft
Est. Value
About This Home
This home is located at 3205 Tuckland Dr, Raleigh, NC 27610 and is currently estimated at $305,036, approximately $223 per square foot. 3205 Tuckland Dr is a home located in Wake County with nearby schools including Walnut Creek Elementary School, West Lake Middle, and Garner High.
Ownership History
Date
Name
Owned For
Owner Type
Purchase Details
Closed on
Aug 16, 2018
Sold by
Mangum Pamela E
Bought by
Mangum Pamela E
Current Estimated Value
Home Financials for this Owner
Home Financials are based on the most recent Mortgage that was taken out on this home.
Original Mortgage
$105,300
Outstanding Balance
$78,199
Interest Rate
4.5%
Mortgage Type
New Conventional
Estimated Equity
$226,837
Purchase Details
Closed on
Nov 21, 2006
Sold by
Mangum Pamela E and Mangum Andre
Bought by
Mangum Pamela E
Home Financials for this Owner
Home Financials are based on the most recent Mortgage that was taken out on this home.
Original Mortgage
$106,473
Interest Rate
6.31%
Mortgage Type
New Conventional
Purchase Details
Closed on
Jul 13, 1999
Sold by
Pulte Home Corp
Bought by
Simpson Pamela E
Home Financials for this Owner
Home Financials are based on the most recent Mortgage that was taken out on this home.
Original Mortgage
$109,844
Interest Rate
7.43%
Mortgage Type
FHA
Create a Home Valuation Report for This Property
The Home Valuation Report is an in-depth analysis detailing your home's value as well as a comparison with similar homes in the area
Purchase History
| Date | Buyer | Sale Price | Title Company |
|---|---|---|---|
| Mangum Pamela E | -- | Carrington Title Svcs Llc | |
| Mangum Pamela E | -- | None Available | |
| Simpson Pamela E | $110,000 | -- |
Source: Public Records
Mortgage History
| Date | Status | Borrower | Loan Amount |
|---|---|---|---|
| Open | Mangum Pamela E | $105,300 | |
| Closed | Mangum Pamela E | $106,473 | |
| Closed | Simpson Pamela E | $109,844 |
Source: Public Records
Tax History
| Year | Tax Paid | Tax Assessment Tax Assessment Total Assessment is a certain percentage of the fair market value that is determined by local assessors to be the total taxable value of land and additions on the property. | Land | Improvement |
|---|---|---|---|---|
| 2025 | $1,190 | $268,342 | $80,000 | $188,342 |
| 2024 | $1,185 | $268,342 | $80,000 | $188,342 |
Source: Public Records
Map
Nearby Homes
- 4312 Viewmont Dr
- 3218 Trassacks Dr
- 2908 Hayling Dr
- 2609 Quarry Springs Rd
- 3604 Rivermist Dr
- 2816 Erinridge Rd
- 2812 Erinridge Rd
- 2809 Benevolence Dr
- 2608 Follow Me Way
- 2700 Benevolence Dr
- 1712 Mayridge Ln
- 2021 Muddy Creek Ct
- 5021 Tura St
- 2403 Savior St
- 2306 Stoney Spring Dr
- 5052 Tura St
- 5118 Anamosa St
- 4316 Haverty Dr
- 4100 Mindspring Dr
- 1649 Brown Owl Dr
- 3209 Tuckland Dr
- 3201 Tuckland Dr
- 3019 Twinfield Ct
- 3215 Tuckland Dr
- 3015 Twinfield Ct
- 3127 Tuckland Dr
- 3023 Twinfield Ct
- 3204 Tuckland Dr
- 3208 Tuckland Dr
- 3200 Tuckland Dr
- 3009 Twinfield Ct
- 3219 Tuckland Dr
- 3119 Tuckland Dr
- 3212 Tuckland Dr
- 3128 Tuckland Dr
- 3027 Twinfield Ct
- 106 Twinfield Ct
- 3124 Tuckland Dr
- 3109 Tuckland Dr
- 3005 Twinfield Ct
Your Personal Tour Guide
Ask me questions while you tour the home.