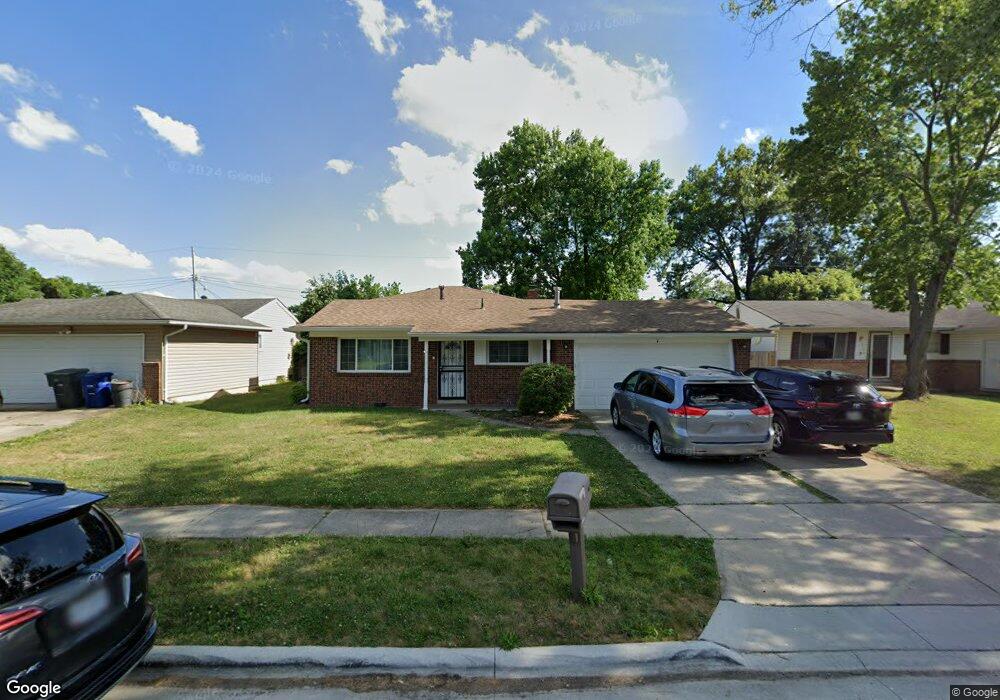
3207 Haskell Dr Columbus, OH 43219
Somerset NeighborhoodEstimated Value: $222,600 - $270,000
3
Beds
2
Baths
1,040
Sq Ft
$241/Sq Ft
Est. Value
About This Home
This home is located at 3207 Haskell Dr, Columbus, OH 43219 and is currently estimated at $250,650, approximately $241 per square foot. 3207 Haskell Dr is a home located in Franklin County with nearby schools including Cassady Elementary School, Mifflin Middle School, and Mifflin High School.
Ownership History
Date
Name
Owned For
Owner Type
Purchase Details
Closed on
Dec 11, 2015
Sold by
Nationald Mortgage Llc
Bought by
Omar Hussein Mohamed
Current Estimated Value
Purchase Details
Closed on
Nov 4, 2015
Sold by
Mclaurin Paul H
Bought by
Nationstar Mortgage Llc
Purchase Details
Closed on
Oct 10, 2003
Sold by
Darling John L and Darling Carole R
Bought by
Mclaurin Paul H
Home Financials for this Owner
Home Financials are based on the most recent Mortgage that was taken out on this home.
Original Mortgage
$94,350
Interest Rate
6.23%
Mortgage Type
VA
Purchase Details
Closed on
Jul 7, 1970
Bought by
Darling John L
Create a Home Valuation Report for This Property
The Home Valuation Report is an in-depth analysis detailing your home's value as well as a comparison with similar homes in the area
Home Values in the Area
Average Home Value in this Area
Purchase History
| Date | Buyer | Sale Price | Title Company |
|---|---|---|---|
| Omar Hussein Mohamed | $42,600 | Omega Title Agency Llc | |
| Nationstar Mortgage Llc | $55,300 | None Available | |
| Mclaurin Paul H | $92,500 | -- | |
| Darling John L | -- | -- |
Source: Public Records
Mortgage History
| Date | Status | Borrower | Loan Amount |
|---|---|---|---|
| Previous Owner | Mclaurin Paul H | $94,350 |
Source: Public Records
Tax History
| Year | Tax Paid | Tax Assessment Tax Assessment Total Assessment is a certain percentage of the fair market value that is determined by local assessors to be the total taxable value of land and additions on the property. | Land | Improvement |
|---|---|---|---|---|
| 2025 | $2,661 | $59,290 | $14,000 | $45,290 |
| 2024 | $2,661 | $59,290 | $14,000 | $45,290 |
| 2023 | $2,627 | $59,290 | $14,000 | $45,290 |
| 2022 | $1,619 | $31,220 | $10,500 | $20,720 |
| 2021 | $1,622 | $31,220 | $10,500 | $20,720 |
| 2020 | $1,624 | $31,220 | $10,500 | $20,720 |
| 2019 | $1,646 | $27,130 | $10,500 | $16,630 |
| 2018 | $821 | $27,130 | $10,500 | $16,630 |
| 2017 | $1,645 | $27,130 | $10,500 | $16,630 |
| 2016 | $1,660 | $23,350 | $4,660 | $18,690 |
| 2015 | $878 | $23,350 | $4,660 | $18,690 |
| 2014 | $880 | $23,350 | $4,660 | $18,690 |
| 2013 | $470 | $24,570 | $4,900 | $19,670 |
Source: Public Records
Map
Nearby Homes
- 2713 Marview Rd
- 3118 Elmreeb Dr
- 3144 Gideon Ln
- 3149 Zach Ct
- 3389 Dillward Dr
- 3667 Parker Knoll Ln
- 3601 Agler Rd
- 2423 Stelzer Rd
- 2275 Stelzer Rd
- 0 Club House Dr
- 2683 Club House Dr
- 2803 Ballyvaughn Dr Unit 48
- 3756 Genessee Ave
- 2559 Milford Ave
- 0 E Aberdeen Ave Unit 226006710
- 3335 Sycamore Knolls Dr
- 0 E Minnesota Ave Unit 224018641
- 2927 Poolside Dr Unit 10
- 2225 Mifflin Blvd
- 2781 Innis Rd Unit F
- 3195 Haskell Dr
- 3219 Haskell Dr
- 3200 Caralee Dr
- 3187 Haskell Dr
- 3208 Caralee Dr
- 3190 Caralee Dr
- 3208 Haskell Dr
- 3214 Caralee Dr
- 3182 Caralee Dr
- 3216 Haskell Dr
- 3225 Haskell Dr
- 3179 Haskell Dr
- 3200 Haskell Dr
- 3224 Haskell Dr
- 3192 Haskell Dr
- 3174 Caralee Dr
- 3222 Caralee Dr
- 3233 Haskell Dr
- 3232 Haskell Dr
- 3184 Haskell Dr
Your Personal Tour Guide
Ask me questions while you tour the home.