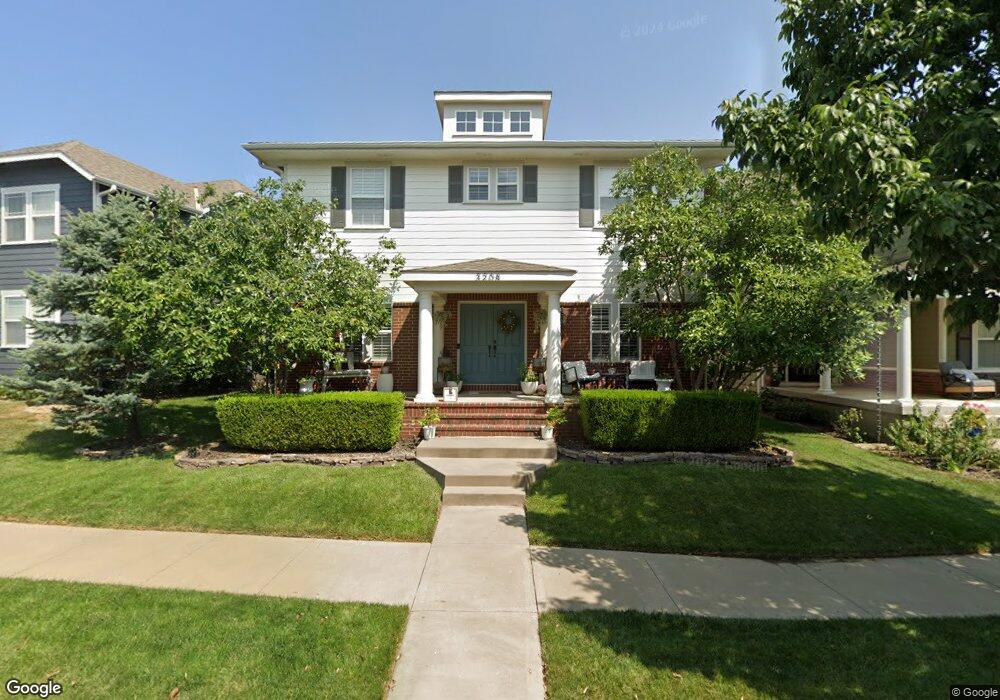
3208 SW Rockbridge Dr Lees Summit, MO 64081
Longview NeighborhoodEstimated Value: $515,000 - $702,000
3
Beds
5
Baths
2,130
Sq Ft
$276/Sq Ft
Est. Value
About This Home
This home is located at 3208 SW Rockbridge Dr, Lees Summit, MO 64081 and is currently estimated at $588,294, approximately $276 per square foot. 3208 SW Rockbridge Dr is a home located in Jackson County with nearby schools including Longview Farm Elementary School, Summit Lakes Middle School, and Lee's Summit West High School.
Ownership History
Date
Name
Owned For
Owner Type
Purchase Details
Closed on
May 17, 2018
Sold by
Linstrom David S and Linstrom Leah R
Bought by
Yeates Benjamin T and Yeates Shannon C
Current Estimated Value
Home Financials for this Owner
Home Financials are based on the most recent Mortgage that was taken out on this home.
Original Mortgage
$308,000
Outstanding Balance
$265,198
Interest Rate
4.4%
Mortgage Type
New Conventional
Estimated Equity
$323,096
Purchase Details
Closed on
Apr 10, 2006
Sold by
Galehomes Inc
Bought by
Lindstrom David S and Lindstrom Leah R
Home Financials for this Owner
Home Financials are based on the most recent Mortgage that was taken out on this home.
Original Mortgage
$295,100
Interest Rate
6.22%
Mortgage Type
Fannie Mae Freddie Mac
Purchase Details
Closed on
Nov 3, 2005
Sold by
Gale Communities Inc
Bought by
Galehomes Inc
Home Financials for this Owner
Home Financials are based on the most recent Mortgage that was taken out on this home.
Original Mortgage
$212,500
Interest Rate
5.75%
Mortgage Type
Construction
Create a Home Valuation Report for This Property
The Home Valuation Report is an in-depth analysis detailing your home's value as well as a comparison with similar homes in the area
Home Values in the Area
Average Home Value in this Area
Purchase History
| Date | Buyer | Sale Price | Title Company |
|---|---|---|---|
| Yeates Benjamin T | -- | None Available | |
| Lindstrom David S | -- | Ctic | |
| Galehomes Inc | -- | Ctic |
Source: Public Records
Mortgage History
| Date | Status | Borrower | Loan Amount |
|---|---|---|---|
| Open | Yeates Benjamin T | $308,000 | |
| Previous Owner | Lindstrom David S | $295,100 | |
| Previous Owner | Galehomes Inc | $212,500 |
Source: Public Records
Tax History
| Year | Tax Paid | Tax Assessment Tax Assessment Total Assessment is a certain percentage of the fair market value that is determined by local assessors to be the total taxable value of land and additions on the property. | Land | Improvement |
|---|---|---|---|---|
| 2025 | $6,146 | $97,390 | $13,351 | $84,039 |
| 2024 | $6,102 | $85,120 | $6,118 | $79,002 |
| 2023 | $6,102 | $85,120 | $6,118 | $79,002 |
| 2022 | $6,795 | $84,170 | $14,837 | $69,333 |
| 2021 | $6,935 | $84,170 | $14,837 | $69,333 |
| 2020 | $6,665 | $80,096 | $14,837 | $65,259 |
| 2019 | $6,482 | $80,096 | $14,837 | $65,259 |
| 2018 | $1,652,319 | $69,710 | $12,913 | $56,797 |
| 2017 | $6,080 | $69,710 | $12,913 | $56,797 |
| 2016 | $5,988 | $67,963 | $10,409 | $57,554 |
Source: Public Records
Map
Nearby Homes
- 1025 SW Armie St
- 3108 SW Pergola Park Dr
- 3262 SW Pergola Park Dr
- 1063 SW Corinthian Ln
- 1112 SW Corinthian Ln
- 1117 SW Corinthian Ln
- 3352 SW Arena St
- 1120 SW Corinthian Ln
- 3238 SW Pergola Park Dr
- 1225 SW Corinthian Ln
- 1224 SW Corinthian Ln
- 1241 SW Corinthian Ln
- 764 SW Redbuck Dr
- 760 SW Redbuck Dr
- 3124 SW Pergola View
- 448 SW Brummel Rd
- 444 SW Brummel Rd
- 442 SW Brummel Rd
- 445 SW Longview Blvd
- 453 SW Longview Blvd
- 3204 SW Rockbridge Dr
- 3212 SW Rockbridge Dr
- 3216 SW Rockbridge Dr
- 3200 SW Rockbridge Dr
- 3220 SW Rockbridge Dr
- 3213 SW Rockbridge Dr
- 3209 SW Rockbridge Dr
- 3185 SW Gardenia St
- 3176 SW Rockbridge Dr
- 3181 SW Gardenia St
- 3193 SW Gardenia St
- 3201 SW Rockbridge Dr
- 3189 SW Gardenia St
- 3221 SW Rockbridge Dr
- 3217 SW Rockbridge Dr
- 3197 SW Gardenia St
- 3175 SW Rockbridge Dr
- 3175 SW Gardenia St
- 3172 SW Rockbridge Dr
- 3201 SW Gardenia St