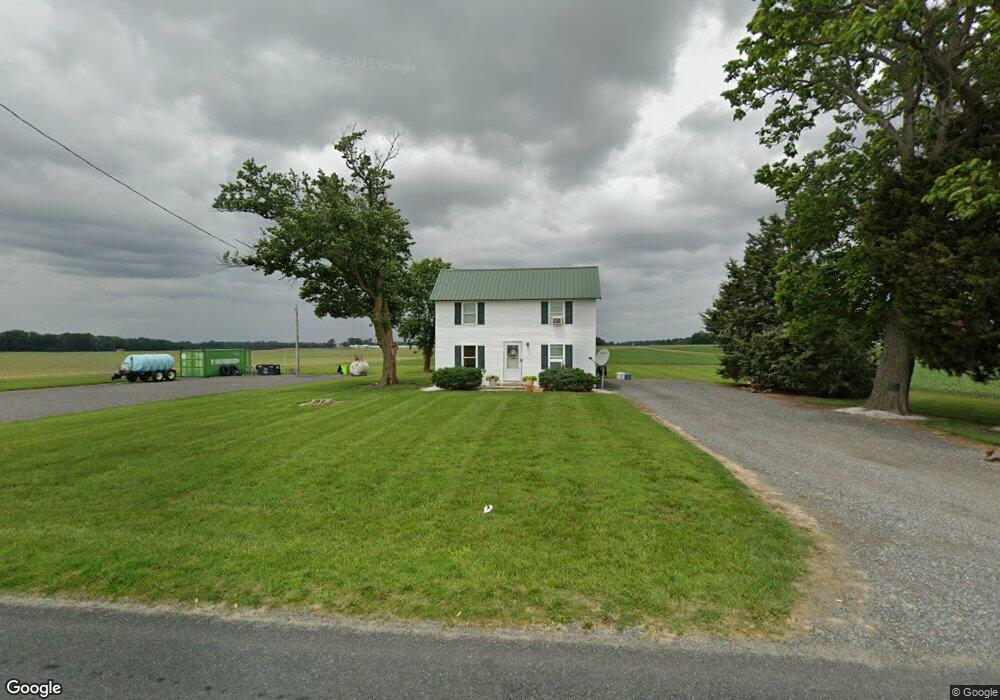
32088 Coveys Landing Rd Cordova, MD 21625
Estimated Value: $126,379 - $310,000
--
Bed
1
Bath
1,104
Sq Ft
$162/Sq Ft
Est. Value
About This Home
This home is located at 32088 Coveys Landing Rd, Cordova, MD 21625 and is currently estimated at $179,345, approximately $162 per square foot. 32088 Coveys Landing Rd is a home located in Talbot County with nearby schools including Chapel District Elementary School, Easton Middle School, and Easton High School.
Ownership History
Date
Name
Owned For
Owner Type
Purchase Details
Closed on
Oct 22, 2024
Sold by
Talbot County
Bought by
Swann Paul Thomas
Current Estimated Value
Purchase Details
Closed on
Dec 31, 2020
Sold by
Worm Investment Group Llc
Bought by
Swann Paul Thomas
Home Financials for this Owner
Home Financials are based on the most recent Mortgage that was taken out on this home.
Original Mortgage
$95,000
Interest Rate
2.7%
Mortgage Type
New Conventional
Purchase Details
Closed on
Dec 7, 2018
Sold by
Sandrock Amy G and The Estate Of Steven E Geib
Bought by
Worm Investment Group Llc
Home Financials for this Owner
Home Financials are based on the most recent Mortgage that was taken out on this home.
Original Mortgage
$58,000
Interest Rate
4.8%
Mortgage Type
Purchase Money Mortgage
Purchase Details
Closed on
Apr 2, 2015
Sold by
Sandrock Amy G and Estate Of Daniel F Geib Jr
Bought by
Sandrock Amy G and Geib Steven E
Create a Home Valuation Report for This Property
The Home Valuation Report is an in-depth analysis detailing your home's value as well as a comparison with similar homes in the area
Home Values in the Area
Average Home Value in this Area
Purchase History
| Date | Buyer | Sale Price | Title Company |
|---|---|---|---|
| Swann Paul Thomas | -- | None Listed On Document | |
| Swann Paul Thomas | $100,000 | Omni Land Settlement Corp | |
| Worm Investment Group Llc | $70,000 | Eastern Shore Title Co | |
| Sandrock Amy G | -- | None Available |
Source: Public Records
Mortgage History
| Date | Status | Borrower | Loan Amount |
|---|---|---|---|
| Previous Owner | Swann Paul Thomas | $95,000 | |
| Previous Owner | Worm Investment Group Llc | $58,000 |
Source: Public Records
Tax History Compared to Growth
Tax History
| Year | Tax Paid | Tax Assessment Tax Assessment Total Assessment is a certain percentage of the fair market value that is determined by local assessors to be the total taxable value of land and additions on the property. | Land | Improvement |
|---|---|---|---|---|
| 2025 | $865 | $93,667 | $0 | $0 |
| 2024 | $865 | $89,933 | $0 | $0 |
| 2023 | $801 | $87,400 | $65,200 | $22,200 |
| 2022 | $748 | $87,400 | $65,200 | $22,200 |
| 2021 | $1,572 | $87,400 | $65,200 | $22,200 |
| 2020 | $1,040 | $130,800 | $103,500 | $27,300 |
| 2019 | $953 | $120,267 | $0 | $0 |
| 2018 | $781 | $101,200 | $0 | $0 |
| 2017 | $714 | $99,200 | $0 | $0 |
| 2016 | $697 | $99,200 | $0 | $0 |
| 2015 | $858 | $99,200 | $0 | $0 |
| 2014 | $858 | $119,700 | $0 | $0 |
Source: Public Records
Map
Nearby Homes
- 11633 Malvern Ln
- 11482 Kittys Corner Rd
- 31127 Willis St
- 0 Baptist Rd
- 0 Cordova Rd Unit MDTA2011672
- 10622 Kittys Corner Rd
- 10640 Kittys Corner Rd
- 31570 Miller Rd
- 0 Skipton Cordova Rd
- Lot B Blades Rd
- Lot A Blades Rd
- 13404 Cannery Rd
- 11292 3 Bridge Branch Rd
- 13500 1st St
- 22005 Main St
- 21948 Main St
- 32115 Park Ave
- 13513 1st St
- 13603 Main St
- E/S MD RT480 Unknown
- 11871 Lewistown Rd
- 31895 Coveys Landing Rd
- 11647 Chapel Rd
- 31864 Bittorf Ln
- 31860 Coveys Landing Rd
- 31850 Bittorf Ln
- 11621 Chapel Rd
- 31873 Bittorf Ln
- 31830 Bittorf Ln
- 11607 Chapel Rd
- 31851 Bittorf Ln
- 11585 Chapel Rd
- 31900 Ruxton Ct
- 31820 Bittorf Ln
- 31975 Coveys Landing Rd
- 31819 Bittorf Ln
- 11573 Chapel Rd
- 31895 Ruxton Ct
- 11594 Chapel Rd
- 12073 Lewistown Rd