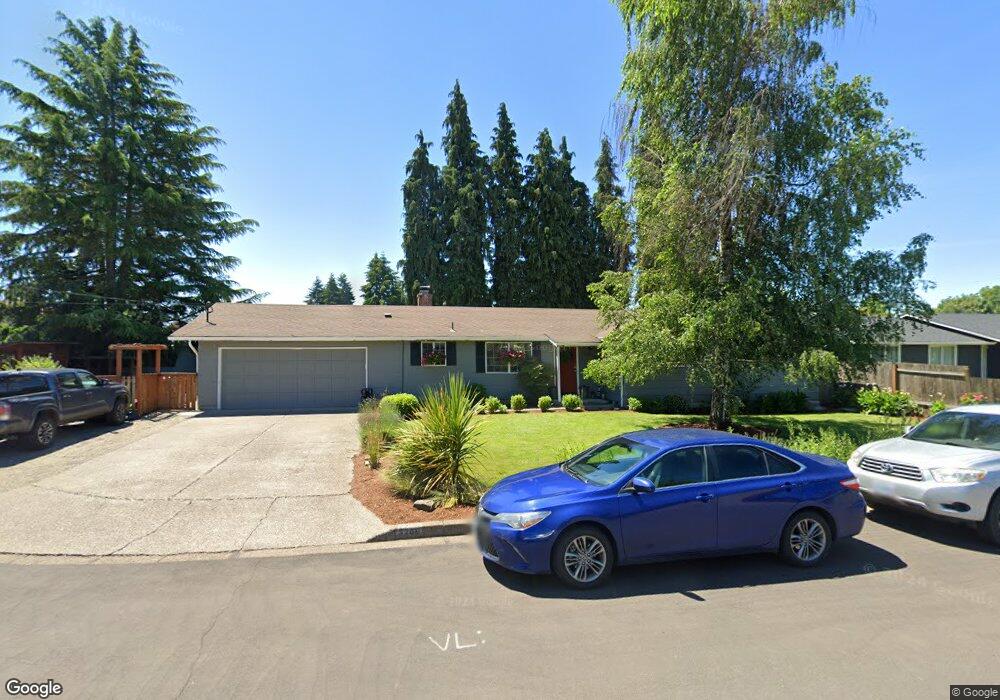
3209 Cindy St Eugene, OR 97404
Santa Clara NeighborhoodEstimated Value: $415,389 - $471,000
3
Beds
2
Baths
1,504
Sq Ft
$296/Sq Ft
Est. Value
About This Home
This home is located at 3209 Cindy St, Eugene, OR 97404 and is currently estimated at $444,847, approximately $295 per square foot. 3209 Cindy St is a home located in Lane County with nearby schools including Spring Creek Elementary School, Madison Middle School, and North Eugene High School.
Ownership History
Date
Name
Owned For
Owner Type
Purchase Details
Closed on
Apr 27, 2009
Sold by
Washburne Lynn G
Bought by
Moss Jered C and Moss Erin M
Current Estimated Value
Home Financials for this Owner
Home Financials are based on the most recent Mortgage that was taken out on this home.
Original Mortgage
$186,558
Outstanding Balance
$117,932
Interest Rate
5.02%
Mortgage Type
FHA
Estimated Equity
$326,915
Purchase Details
Closed on
Oct 27, 2004
Sold by
Washburne Lynn G
Bought by
Washburne Lynn G
Home Financials for this Owner
Home Financials are based on the most recent Mortgage that was taken out on this home.
Original Mortgage
$51,000
Interest Rate
5.7%
Mortgage Type
New Conventional
Purchase Details
Closed on
Feb 3, 2003
Sold by
Lewis Ronald J and Lewis Janet B
Bought by
Washburne Lynn G
Home Financials for this Owner
Home Financials are based on the most recent Mortgage that was taken out on this home.
Original Mortgage
$153,250
Interest Rate
5.83%
Create a Home Valuation Report for This Property
The Home Valuation Report is an in-depth analysis detailing your home's value as well as a comparison with similar homes in the area
Home Values in the Area
Average Home Value in this Area
Purchase History
| Date | Buyer | Sale Price | Title Company |
|---|---|---|---|
| Moss Jered C | $190,000 | Western Title | |
| Washburne Lynn G | -- | -- | |
| Washburne Lynn G | $158,000 | Western Pioneer Title Co |
Source: Public Records
Mortgage History
| Date | Status | Borrower | Loan Amount |
|---|---|---|---|
| Open | Moss Jered C | $186,558 | |
| Previous Owner | Washburne Lynn G | $51,000 | |
| Previous Owner | Washburne Lynn G | $153,250 |
Source: Public Records
Tax History
| Year | Tax Paid | Tax Assessment Tax Assessment Total Assessment is a certain percentage of the fair market value that is determined by local assessors to be the total taxable value of land and additions on the property. | Land | Improvement |
|---|---|---|---|---|
| 2025 | $3,060 | $239,081 | -- | -- |
| 2024 | $3,044 | $232,118 | -- | -- |
| 2023 | $3,044 | $225,358 | $0 | $0 |
| 2022 | $2,861 | $218,795 | $0 | $0 |
| 2021 | $2,625 | $212,423 | $0 | $0 |
| 2020 | $2,674 | $206,236 | $0 | $0 |
| 2019 | $2,575 | $200,230 | $0 | $0 |
| 2018 | $2,371 | $188,737 | $0 | $0 |
| 2017 | $2,245 | $188,737 | $0 | $0 |
| 2016 | $2,093 | $183,240 | $0 | $0 |
| 2015 | $2,016 | $177,903 | $0 | $0 |
| 2014 | $1,887 | $172,721 | $0 | $0 |
Source: Public Records
Map
Nearby Homes
- 51 Grizzly Ave
- 374 Blackfoot Ave
- 190 River Loop 1
- 3256 Marvin Dr
- 346 River Loop 1
- 349 Irving Rd
- 504 Dean Ave
- 2612 Sage St
- 2721 La Darrah St
- 329 Dean Ave
- 215 Jonquil Ave
- 230 River Loop 2
- 190 Hunsaker Ln
- 3698 Revell St
- 355 River Loop 2
- 193 Santa Clara Ave
- 84 Green Ln
- 591 Argon Ave
- 2563 York St
- 2690 Carbona St
Your Personal Tour Guide
Ask me questions while you tour the home.