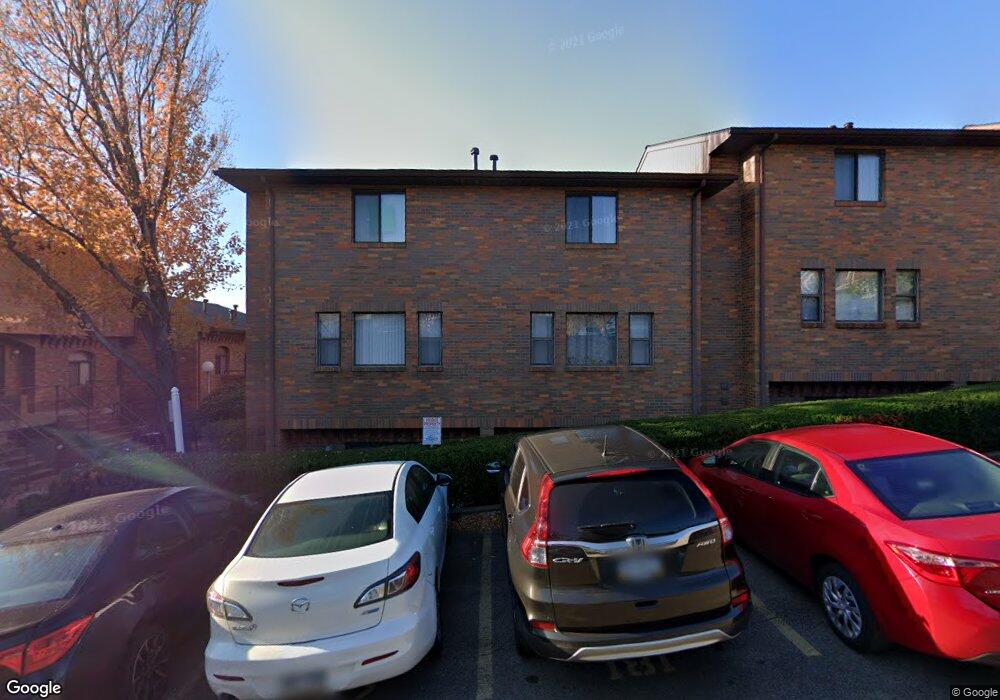
3209 Niagara Square Pittsburgh, PA 15213
South Oakland NeighborhoodEstimated Value: $316,202 - $727,000
6
Beds
3
Baths
2,568
Sq Ft
$178/Sq Ft
Est. Value
About This Home
This home is located at 3209 Niagara Square, Pittsburgh, PA 15213 and is currently estimated at $457,301, approximately $178 per square foot. 3209 Niagara Square is a home located in Allegheny County with nearby schools including Pittsburgh Greenfield K-8, Pittsburgh Allderdice High School, and Central Academy.
Ownership History
Date
Name
Owned For
Owner Type
Purchase Details
Closed on
Dec 31, 2020
Sold by
S M A Howley L L C
Bought by
Kya R E Group L L C
Current Estimated Value
Purchase Details
Closed on
Nov 10, 2020
Sold by
Perlick Harold C and Perlick Deborah R
Bought by
S M A Howley L L C
Purchase Details
Closed on
Sep 20, 2000
Sold by
Casciato Carmine
Bought by
Perlick Harold C and Perlick Deborah R
Create a Home Valuation Report for This Property
The Home Valuation Report is an in-depth analysis detailing your home's value as well as a comparison with similar homes in the area
Home Values in the Area
Average Home Value in this Area
Purchase History
| Date | Buyer | Sale Price | Title Company |
|---|---|---|---|
| Kya R E Group L L C | $252,800 | None Available | |
| S M A Howley L L C | $170,000 | Pv Settlement Llc | |
| Perlick Harold C | $40,500 | -- |
Source: Public Records
Tax History Compared to Growth
Tax History
| Year | Tax Paid | Tax Assessment Tax Assessment Total Assessment is a certain percentage of the fair market value that is determined by local assessors to be the total taxable value of land and additions on the property. | Land | Improvement |
|---|---|---|---|---|
| 2025 | $1,728 | $75,000 | $22,600 | $52,400 |
| 2024 | $1,728 | $75,000 | $22,600 | $52,400 |
| 2023 | $1,728 | $75,000 | $22,600 | $52,400 |
| 2022 | $1,706 | $75,000 | $22,600 | $52,400 |
| 2021 | $1,706 | $75,000 | $22,600 | $52,400 |
| 2020 | $1,697 | $75,000 | $22,600 | $52,400 |
| 2019 | $1,697 | $75,000 | $22,600 | $52,400 |
| 2018 | $1,361 | $75,000 | $22,600 | $52,400 |
| 2017 | $1,697 | $75,000 | $22,600 | $52,400 |
| 2016 | $355 | $75,000 | $22,600 | $52,400 |
| 2015 | $355 | $75,000 | $22,600 | $52,400 |
| 2014 | $1,660 | $75,000 | $22,600 | $52,400 |
Source: Public Records
Map
Nearby Homes
- 3209 Niagara St Unit 1
- 3209 Niagara St Unit 2
- 3207 Niagara Square
- 3211 Niagara Square
- 3211 Niagara St Unit 3
- 3211 Niagara St Unit 1
- 3205 Niagara Square
- 3203 Niagara Square
- 3213 Niagara Square
- 3299 Kennett Square
- 363 Ophelia St
- 3291 Kennett Square Unit 342
- 3295 Kennett Square Unit 352
- 3295 Kennett Square
- 3201 Niagara St
- 3201 Niagara Square
- 361 Ophelia St
- 3297 Kennett Square
- 3293 Kennett Square
- 3297 Kennett Square