Estimated Value: $189,982 - $210,000
3
Beds
1
Bath
1,098
Sq Ft
$183/Sq Ft
Est. Value
About This Home
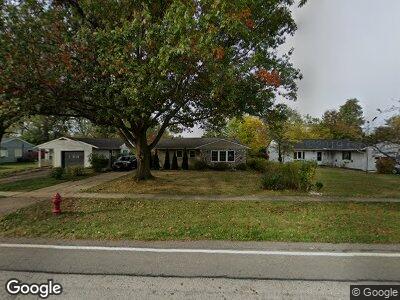
This home is located at 321 Barrett Rd, Berea, OH 44017 and is currently estimated at $200,746, approximately $182 per square foot. 321 Barrett Rd is a home located in Cuyahoga County with nearby schools including Grindstone Elementary School, Berea-Midpark Middle School, and Berea-Midpark High School.
Ownership History
Date
Name
Owned For
Owner Type
Purchase Details
Closed on
Dec 3, 2020
Sold by
Kidwell Jack Robert
Bought by
Kidwell Jack Robert and Crider Cheryl Lynne
Current Estimated Value
Purchase Details
Closed on
Feb 26, 2007
Sold by
Yanik David A and Varga Nancy U
Bought by
Kidwell Jack Robert
Home Financials for this Owner
Home Financials are based on the most recent Mortgage that was taken out on this home.
Original Mortgage
$144,000
Interest Rate
6.23%
Mortgage Type
Purchase Money Mortgage
Purchase Details
Closed on
Jan 2, 2006
Sold by
Petri Faith J
Bought by
Yanik David A and Varga Nancy U
Home Financials for this Owner
Home Financials are based on the most recent Mortgage that was taken out on this home.
Original Mortgage
$70,400
Interest Rate
8.12%
Mortgage Type
Fannie Mae Freddie Mac
Purchase Details
Closed on
Jan 1, 1975
Bought by
Petri Faith J
Create a Home Valuation Report for This Property
The Home Valuation Report is an in-depth analysis detailing your home's value as well as a comparison with similar homes in the area
Home Values in the Area
Average Home Value in this Area
Purchase History
| Date | Buyer | Sale Price | Title Company |
|---|---|---|---|
| Kidwell Jack Robert | -- | None Available | |
| Kidwell Jack Robert | $144,000 | Title Access Llc | |
| Yanik David A | $88,000 | Evergreen Title | |
| Petri Faith J | -- | -- |
Source: Public Records
Mortgage History
| Date | Status | Borrower | Loan Amount |
|---|---|---|---|
| Open | Kidwell Jack Robert | $137,300 | |
| Closed | Kidwell Jack Robert | $144,000 | |
| Previous Owner | Yanik David A | $40,880 | |
| Previous Owner | Yanik David A | $70,400 |
Source: Public Records
Tax History Compared to Growth
Tax History
| Year | Tax Paid | Tax Assessment Tax Assessment Total Assessment is a certain percentage of the fair market value that is determined by local assessors to be the total taxable value of land and additions on the property. | Land | Improvement |
|---|---|---|---|---|
| 2024 | $3,681 | $62,300 | $11,620 | $50,680 |
| 2023 | $3,138 | $44,450 | $9,870 | $34,580 |
| 2022 | $3,119 | $44,450 | $9,870 | $34,580 |
| 2021 | $3,095 | $44,450 | $9,870 | $34,580 |
| 2020 | $2,957 | $37,660 | $8,370 | $29,300 |
| 2019 | $2,880 | $107,600 | $23,900 | $83,700 |
| 2018 | $2,795 | $37,660 | $8,370 | $29,300 |
| 2017 | $2,917 | $35,600 | $7,110 | $28,490 |
| 2016 | $2,896 | $35,600 | $7,110 | $28,490 |
| 2015 | $2,883 | $35,600 | $7,110 | $28,490 |
| 2014 | $2,883 | $37,450 | $7,490 | $29,960 |
Source: Public Records
Map
Nearby Homes
- 452 N Rocky River Dr
- 344 Butternut Ln
- 394 Sherry Ln
- 376 Runn St
- 724 Shelley Pkwy
- 306 Runn St
- 531 Lindbergh Blvd
- 135 W Bagley Rd
- 166 Marian Ln
- 6574 Burton Dr
- 8651 Lindbergh Blvd
- 100 Kraft St
- 7587 Lewis Rd
- 24481 Barrett Rd
- 347 Beeler Dr
- 20385 Brookstone Trail
- 14369 E Bagley Rd
- 56 Beech St
- 0 E Bagley Rd Unit 5111166
- 346 Pattie Dr