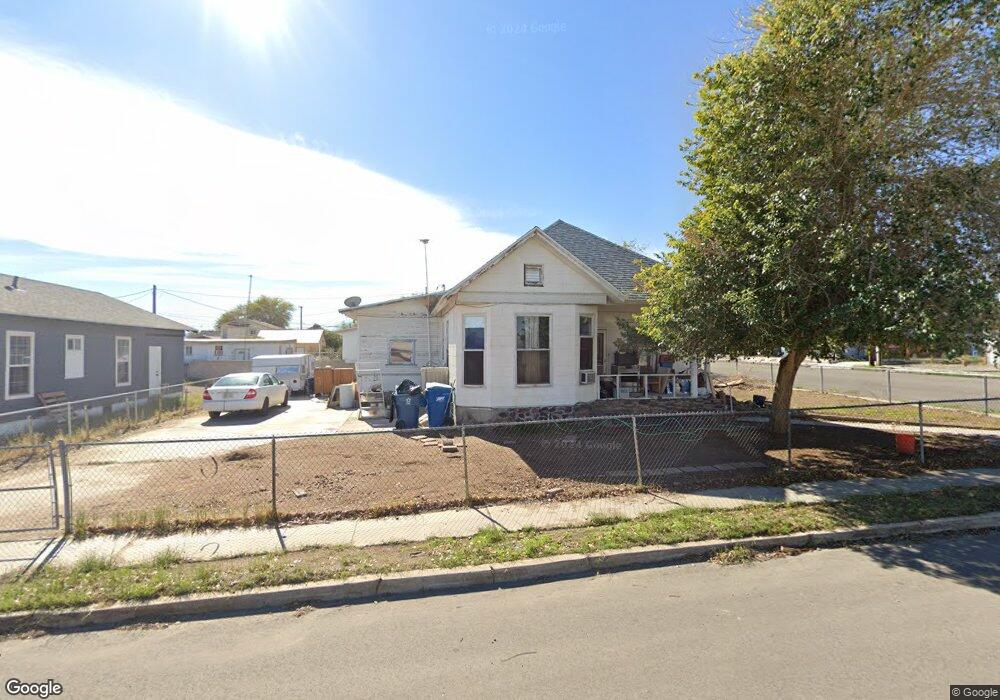
321 Bazoobuth St Needles, CA 92363
Estimated Value: $69,000 - $124,000
2
Beds
1
Bath
1,155
Sq Ft
$87/Sq Ft
Est. Value
About This Home
This home is located at 321 Bazoobuth St, Needles, CA 92363 and is currently estimated at $100,206, approximately $86 per square foot. 321 Bazoobuth St is a home located in San Bernardino County with nearby schools including Vista Colorado Elementary School, Chemehuevi Valley Elementary School, and Needles Middle School.
Ownership History
Date
Name
Owned For
Owner Type
Purchase Details
Closed on
Feb 25, 2026
Sold by
Johnson Clifford B and Johnson Patricia A
Bought by
Pelican Place Properties Llc
Current Estimated Value
Home Financials for this Owner
Home Financials are based on the most recent Mortgage that was taken out on this home.
Original Mortgage
$58,000
Outstanding Balance
$58,000
Interest Rate
6.06%
Mortgage Type
New Conventional
Estimated Equity
$42,206
Create a Home Valuation Report for This Property
The Home Valuation Report is an in-depth analysis detailing your home's value as well as a comparison with similar homes in the area
Home Values in the Area
Average Home Value in this Area
Purchase History
| Date | Buyer | Sale Price | Title Company |
|---|---|---|---|
| Pelican Place Properties Llc | $45,000 | Lawyers Title Company |
Source: Public Records
Mortgage History
| Date | Status | Borrower | Loan Amount |
|---|---|---|---|
| Open | Pelican Place Properties Llc | $58,000 |
Source: Public Records
Tax History
| Year | Tax Paid | Tax Assessment Tax Assessment Total Assessment is a certain percentage of the fair market value that is determined by local assessors to be the total taxable value of land and additions on the property. | Land | Improvement |
|---|---|---|---|---|
| 2025 | $577 | $43,285 | $6,662 | $36,623 |
| 2024 | $565 | $42,436 | $6,531 | $35,905 |
| 2023 | $613 | $41,604 | $6,403 | $35,201 |
| 2022 | $597 | $40,788 | $6,277 | $34,511 |
| 2021 | $585 | $39,988 | $6,154 | $33,834 |
| 2020 | $579 | $39,578 | $6,091 | $33,487 |
| 2019 | $580 | $38,802 | $5,972 | $32,830 |
| 2018 | $577 | $38,041 | $5,855 | $32,186 |
| 2017 | $559 | $37,295 | $5,740 | $31,555 |
| 2016 | $510 | $36,563 | $5,627 | $30,936 |
| 2015 | $385 | $36,013 | $5,542 | $30,471 |
| 2014 | $346 | $35,307 | $5,433 | $29,874 |
Source: Public Records
Map
Nearby Homes
Your Personal Tour Guide
Ask me questions while you tour the home.