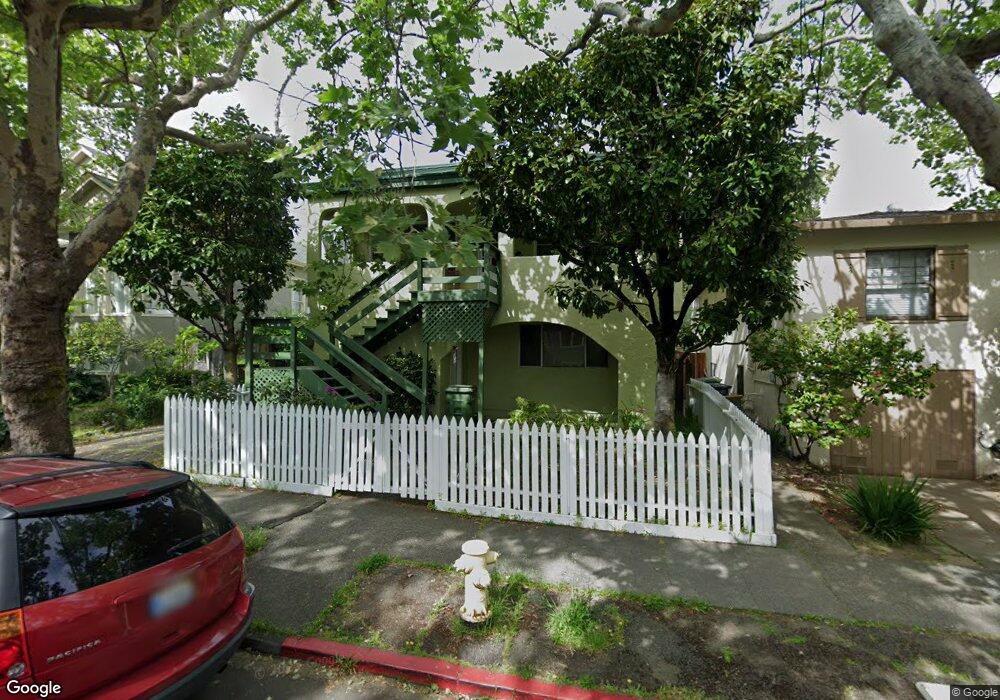
321 C St San Rafael, CA 94901
Gerstle Park NeighborhoodEstimated Value: $922,000 - $1,303,513
5
Beds
2
Baths
2,429
Sq Ft
$471/Sq Ft
Est. Value
About This Home
This home is located at 321 C St, San Rafael, CA 94901 and is currently estimated at $1,144,878, approximately $471 per square foot. 321 C St is a home located in Marin County with nearby schools including Laurel Dell Elementary School, James B. Davidson Middle School, and San Rafael High School.
Ownership History
Date
Name
Owned For
Owner Type
Purchase Details
Closed on
May 5, 2006
Sold by
Rollins Madeleine D and Rollins Madeleine
Bought by
The Madeleine Dickey Rollins Living Tr and Rollins Madeleine Dickey
Current Estimated Value
Purchase Details
Closed on
Nov 10, 1999
Sold by
Rollins Frank W
Bought by
Rollins Madeleine D and Rollins Madeleine
Home Financials for this Owner
Home Financials are based on the most recent Mortgage that was taken out on this home.
Original Mortgage
$222,000
Outstanding Balance
$68,137
Interest Rate
7.82%
Estimated Equity
$1,076,741
Create a Home Valuation Report for This Property
The Home Valuation Report is an in-depth analysis detailing your home's value as well as a comparison with similar homes in the area
Home Values in the Area
Average Home Value in this Area
Purchase History
| Date | Buyer | Sale Price | Title Company |
|---|---|---|---|
| The Madeleine Dickey Rollins Living Tr | -- | None Available | |
| Rollins Madeleine D | $111,000 | Pacific Coast Title Company |
Source: Public Records
Mortgage History
| Date | Status | Borrower | Loan Amount |
|---|---|---|---|
| Open | Rollins Madeleine D | $222,000 |
Source: Public Records
Tax History
| Year | Tax Paid | Tax Assessment Tax Assessment Total Assessment is a certain percentage of the fair market value that is determined by local assessors to be the total taxable value of land and additions on the property. | Land | Improvement |
|---|---|---|---|---|
| 2025 | $11,160 | $672,134 | $305,516 | $366,618 |
| 2024 | $10,539 | $658,957 | $299,526 | $359,431 |
| 2023 | $10,249 | $646,037 | $293,653 | $352,384 |
| 2022 | $9,751 | $633,371 | $287,896 | $345,475 |
| 2021 | $9,613 | $620,955 | $282,252 | $338,703 |
| 2020 | $9,576 | $614,589 | $279,359 | $335,230 |
| 2019 | $9,175 | $602,540 | $273,882 | $328,658 |
| 2018 | $9,546 | $590,727 | $268,512 | $322,215 |
| 2017 | $9,228 | $579,146 | $263,248 | $315,898 |
| 2016 | $8,919 | $567,791 | $258,087 | $309,704 |
| 2015 | $8,529 | $559,266 | $254,212 | $305,054 |
| 2014 | $8,139 | $548,310 | $249,232 | $299,078 |
Source: Public Records
Map
Nearby Homes
Your Personal Tour Guide
Ask me questions while you tour the home.